Foreword
I am very grateful to Dr Servet Yanatma for producing this report on the state of digital news consumption in Turkey.
The study is based on analysis of survey data collected as part of the Reuters Institute Digital News Report 2018. The Digital News Report is the world’s largest ongoing survey of news consumption, covering 37 markets in 2018, of which Turkey was just one. The primary purpose of this report is to provide a more detailed examination of the Turkish data, but where we feel that it is useful, we compare the results from Turkey with those from the other markets included in the 2018 study. Full details of work carried out in the other markets are provided in the main Digital News Report 2018, which is available from www.digitalnewsreport.org.
Journalism is a highly contested space in Turkey at present with many studies focused primarily on the important issues around freedom of expression. The focus of this report by contrast is on how news consumption is developing in Turkey. This year’s report also includes one of the new features from the Digital News Report 2018, namely trust scores at the brand level. Some of the trends in Turkey are similar to those elsewhere. But there are others, where differences in behaviour may be linked to the polarised nature of the Turkish political environment.
Servet Yanatma’s contribution has been to take a dispassionate look at key trends in Turkey, presenting the findings, and placing them in context for people not familiar with the Turkish media scene, but also leaving the reader free to draw their own conclusions. The Reuters Institute is grateful to him for all the work that has gone into this important report and hopes that it finds a wide readership.
Dr David Levy
Former Director, Reuters Institute for the Study of Journalism, University of Oxford
Methodology and Background
General Observations on Data
This study is based on analysis of data collected as part of the Reuters Institute Digital News Report 2018. The original study was commissioned by the Reuters Institute for the Study of Journalism at the University of Oxford (RISJ) to understand how news is being consumed in a range of countries, including Turkey. Research was conducted by YouGov using an online questionnaire at the end of January/beginning of February 2018. The report is based on a survey of more than 74,000 people in 37 markets.
The data were weighted to targets based on census/industry accepted data, such as age, gender, and region, to represent the total population of each country. The sample is reflective of the population that has access to the internet.
As this survey dealt with news consumption, any respondent who said that they had not consumed any news in the past month was filtered from the results to ensure that irrelevant responses did not impact upon data quality.
A comprehensive online questionnaire was designed to capture all aspects of news consumption. The questionnaire and the overall project methodology were consistent across all territories.
The survey was conducted using established online panels run by the polling company YouGov and its partners. Because this is an online survey the results will under-represent the consumption habits of people who are not online (typically older, less affluent, and with limited formal education). Where relevant, this has been clarified within the text. The main purpose is to track the activities and changes over time within the digital space – as well as gaining understanding about how offline media and online media are used together. A fuller description of the methodology and a discussion of non-probability sampling techniques can be found at
www.digitalnewsreport.org.
Along with country-based figures, throughout the report aggregate figures are used based on responses from all respondents across all the countries covered. These figures are meant only to indicate overall tendencies and should be treated with caution.
Please note that in Turkey (as well as Brazil, Mexico, and other countries with relatively low internet penetration) the samples are more representative of urban rather than national populations, which must be taken into consideration when interpreting results.
The original survey included the following territories: Argentina, Australia, Austria, Belgium, Brazil, Bulgaria, Canada, Chile, Croatia, Czech Republic, Denmark, Finland, France, Germany, Greece, Hong Kong, Hungary, Ireland, Italy, Japan, Malaysia, Mexico, Netherlands, Norway, Poland, Portugal, Romania, Singapore, Slovakia, South Korea, Spain, Sweden, Switzerland, Taiwan, Turkey, UK, and USA.
In 14 countries, respondents this year were only able to take the survey using a desktop or laptop computer. Although all other quotas were met (e.g. age, gender, region), it is possible that the figures for device use in those countries may have been affected, specifically computer/laptop figures may be inflated and in some countries smartphone and tablet numbers may be lower than expected. It is important to keep in mind that many people use multiple devices, and the dataset still contains smartphone and tablet users who also use a computer. The countries affected were Italy, Japan, Netherlands, Brazil, Spain, Canada, Czech Republic, Poland, Portugal, Austria, South Korea, Switzerland, Hungary, and Turkey.
The full questionnaire, as well as details of the samples used in each market, can be accessed at www.digitalnewsreport.org.
Specific Observations in Turkish Data
While the samples are over-representative of the urban population in Turkey, the survey was carried out in all geographic regions of the country and not restricted just to a few major cities. The survey base is composed of 2019 respondents. (1007 male, and 1012 female).
Figure 1: Age scale of respondents
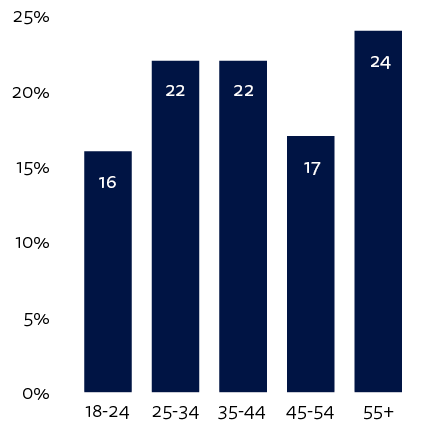
Figure 2: Political leaning
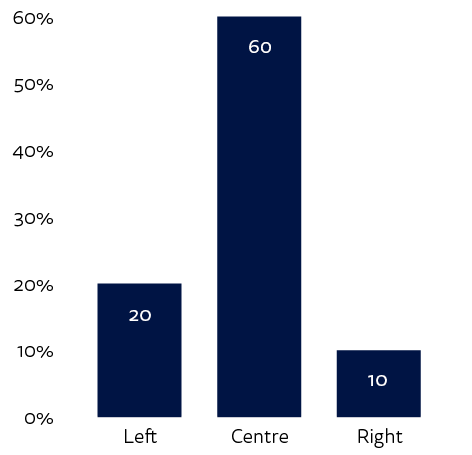
Q1F. Some people talk about ‘left’, ‘right’, and ‘centre’ to describe parties and politicians. (Generally socialist parties would be considered ‘left wing’ while conservative parties would be considered ‘right wing’). With this in mind, where would you place yourself on the following scale? Note: excludes respondents who replied ‘Do not know’.
Executive Summary
Sources of News
• Online, including social media, is at the top of the list of sources of news used weekly with a weekly reach of 87%, followed by TV (77%), printed media (46%), and radio (39%). Two-thirds of our urban sample (66%) use social media for news, though this has declined from a peak of 73% in 2016.
• In response to questions on the main news sources, TV comes first with 48%, and online including social media (39%) follows. The shares of radio (7%) and printed media (6%) are low as main sources.
• While the percentage of respondents citing online media as the main source of news had increased markedly from 32% to 39% between 2015 and 2017, the rise of online media has stalled this year.
• The share of digital-born news outlets (websites/apps of other news outlets) has not increased and remains at 7%.
• Online media (45%) is the primary source for left-wing respondents whereas TV (59%) is for those on the right.
News Devices and Gateways
• In terms of devices used to access news online, laptop/desktop computers and smartphones are the most important, both as main sources of news (42% versus 43%) and in terms of overall weekly reach (computers 67% and smartphones 72%).
• The share of smartphones as the main device used to access news has risen very significantly from 28% to 43% in three years due mainly to the decline in computers, which fell from 55% to 42% in the same period. The smartphone thus overtook the computer for the first time.
• The younger the respondents the more they use smartphones to access news. In the 18–24 age group 53% use the smartphone as their main device whereas it is 31% for over 55s.
• Among the main gateways to news, search is the primary route at 33%. Direct access and social media follow it at 29% and 20% respectively.
• For the over 55s, direct access is the primary route whereas search is the preferred gateway for other age groups. Besides search (33%), the share of social media for the youngest cohort (18–24) is also very high at 30%.
Top Media Brands
• Television channels clearly continue to dominate the traditional top brands. FOX TV is still the most preferred source both in weekly usage and as a main source, followed by CNN Türk, NTV, and TRT.
• There are only two newspapers (Hürriyet and Sözcü) in the top ten traditional brands.
• CNN Türk, Hürriyet, Mynet, NTV, and Sözcü are the most popular online news brands.
Trust in News
• It is remarkable that the figures for overall trust (38%) and distrust (40%) in Turkish news media are remarkably similar. This is an indicator of a very polarised society and news media in the country.
• Distrust in news is 2 percentage points higher than trust this year, and Turkey shares the top position for distrust with three countries.
• Trust is low for social media and search at 33% and 38% respectively.
• Political leaning plays a significant role in trust in news. Overall trust in news is higher on the right (51%) than the left (29%).
• The youngest respondents have the lowest level of trust in news overall, with just 28% in the 18–24 age group, whereas it is 43% for over 55s.
• Some brands are trusted much more than others but the report also underlines how strongly trust can be influenced by pre-existing views about politics.
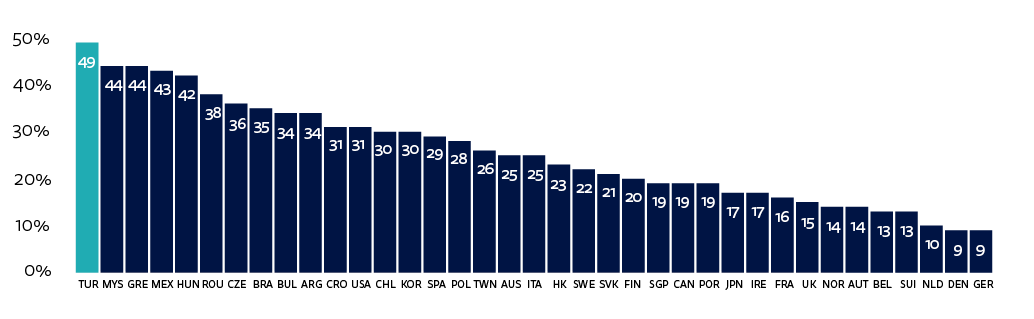
Misinformation
• 49% of respondents stated that they have come across ‘stories that are completely made up for political or commercial reasons’. Turkey is clearly in the lead on this whereas the average across all 37 countries is 26%.
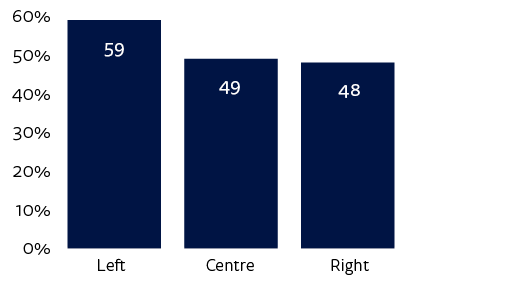
• This may reflect a polarised political and media environment but is not unique to any one side of the political divide. While left-wing respondents reported more exposure to completely made-up news at 59%, the figure is also very high for respondents on the centre and the right at 49% and 48% respectively.
Social Media Messaging
• Decline in the use of Facebook for news continued, as it fell by 18 percentage points in the past three years. The rise of closed messaging services like WhatsApp also continued, up 5 percentage points this year, making a 13 percentage point increase over the past two years. This rise may be linked to fears about government surveillance on social networks.
• Turkey is at the top of all 37 countries for the proportion (65%) stating concern that openly expressing their political views online could get them into trouble with the authorities.
1. Introduction
Turkey was under a state of emergency until July 2018 after the failed coup attempt of July 2016, in which 248 people were killed and hundreds injured. It has generally helped the ruling AK party to gradually strengthen its control over the media. In 2018 the independent watchdog Freedom House classified Turkey as ‘not free’ for the first time. Media freedom in the country has deteriorated over the past year with further intimidation of journalists, the sale of a leading media group to a pro-government businessman, and new laws to restrict internet broadcasts.
The most significant development is the sale by Turkish media mogul Aydin Dogan of all his media outlets to Demirören Holding, a pro-government conglomerate with interests primarily in energy and construction. Dogan Media owned the top-selling Hürriyet daily, CNN Türk, a nationwide news agency, TV channels, radio stations, and the Yay-Sat distribution network. In a leaked phone conversation with then Prime Minister Tayyip Erdoğan in 2014, the owner of Demirören was apparently reduced to tears by the Prime Minister and apologised for a critical article in his newspaper (the New York Times 2018).
Opposition figures have said the sale creates a ‘big monopoly’ in Turkish media, and it is widely seen as being likely to further limit the free press. Veteran journalist Kadri Gürsel tweeted: ‘By this huge takeover including Hürriyet, the Turkish mass media industry comes under the direct political control of President Erdoğan.’ It is significant that the Dogan Group was larger than Demirören when the ruling party came into power in 2002. After the sale, several high-level editors including the editors-in-chief were changed, and several journalists were fired.
Secondly, at the suggestion of the ruling party, a law on internet broadcasting was introduced, requiring online video-streaming services to apply for a licence from the regulator, RTUK. Without a permit access can be blocked. RTUK checks the content and has the power to issue fines. Opponents say the government is tightening controls with powers to block and remove content from news sites and social media already being used. As five of the nine members on RTUK’s governing council are appointed by the ruling party, critics argue that the licensing mechanism itself is likely to be abused by the government.
While the impact of the law is debated, a leading expert, Yaman Akdeniz, says: ‘Every Turkish media service provider with internet media services operating from outside Turkey will be subject to licensing.’ (Akdeniz 2018) In theory any journalist or individual who posts a video on the internet will also need a licence. This is likely to affect alternative news providers, since most of the news outlets that can criticise the government are online, and the internet is the main news source for people who oppose the government (Yanatma 2017). Live streaming through Periscope and YouTube have increasingly become popular for free media such as Medyascope TV and Özgürüz. DW Turkish also increased its content on YouTube by hiring several experienced Turkish journalists. Some independent journalists, such as Ünsal Ünlü, stream regular live news shows as well.1 The YouTube broadcasting of journalists such as Cüneyt Özdemir has reached large audiences.2 Perhaps as a result, news usage of YouTube (9 percentage points) and Twitter (10 percentage points) have risen significantly in the past year.
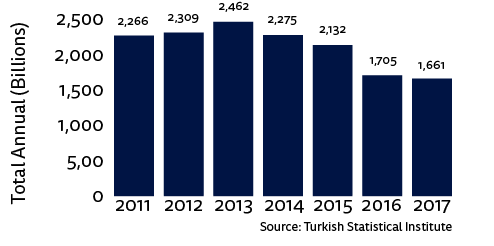
The circulation of printed media has tended to decline in recent years (TÜİK 2016). The most dramatic decrease occurred in 2016 mainly due to the closure of some newspapers after the coup attempt, with the number of printed newspapers and magazines declining by 7.9% and overall circulation falling by 20% in 2016 compared with 2015 (TÜİK 2017). The decline continued into 2017, when overall circulation of printed newspapers and magazines decreased by 2.6%.
Figure 3: Circulation of printed media (newspapers and magazines)
Besides circulation, advertising revenues for newspapers have taken a hit. Printed media’s share of advertising revenues (12%) continued to decline in 2017 by 2.8 percentage points whereas digital advertising (25.9%) continues to grow and is now second only to television (47.8%) (Deloitte 2018).
Among the printed media, the most crucial development was the ending of the print edition of Habertürk daily just after the historic presidential elections on 24 June 2018 due to its reduced sales and higher costs. It was one of Turkey’s largest-circulation newspapers. Mehmet Kenan Tekdağ, chair of the board of directors of Ciner Yayin Holding, explained the reason why the print edition ended as follows: ‘The cost of publishing a newspaper has become unbearable at a time when advertisements are mainly channelled into digital media outlets and broadcasters.’ Tekdağ also stated that the circulation of Turkish newspapers and their share of advertising revenues have been declining steadily while printing costs have been rising over the past five years. He added that internet platforms have become more easily accessible and TV’s share of advertising revenues has also increased. Following the end of its print edition Habertürk now focuses on its online operations (Hürriyet Daily News 2018). It would not be surprising if some other newspapers also close. Despite the decline in the advertising share taken by papers, we have also seen the launch of two new daily newspapers, Karar in March 2016 and Yeni Yaşam in May 2018, but their reach is limited.
This year, for the first time, our data show trust scores for individual news brands. It is striking that pro-government outlets like Sabah and Ahaber and public broadcaster TRT have the lowest trust among people who are simply aware of them, whereas media that take a more critical line such as FOX, Cumhuriyet, and Sözcü are at the top. Traditional media brands using content repackaged from print, television, or from news agencies, and digital-born web portals that aggregate stories from the same sources, continue to represent the biggest online media. Apart from them, there are very few digital-born brands (just Onedio and OdaTV) in the list of top brands used online.
Beyond mainstream media, there are a number of smaller digital-born brands that continue to operate freely, providing alternative perspectives. These include OdaTV, Duvar, T24, Diken, Bianet, Medyascope TV, Ahval News, which is funded by Al Arab Publishing, Journo, ArtıTV, and Dokuz8Haber. However, they have generally not yet found successful business models, and they cannot afford to employ full-time experienced reporters for investigative journalism.3 They are mostly accessed by educated people in the big cities and attempt to reach other audiences through social media. The Turkish sections of international brands such as BBC Turkish and DW also produce consistent coverage of Turkey for use both within the country and by Turks abroad.
2. Sources of News
2.1. Distribution of News Sources
Television and online news are the most frequently accessed news sources in Turkey, and there is almost no change from 2017 in the position of these in terms of both weekly use and main news sources. TV and online media still dominate the main sources. The most remarkable point is that the gradual increase of online media as the main source has stalled this year as TV has kept its strong position in this category.
Online news including social media is at the top of the list of sources of news used in the last week at 87%. Two-thirds of our urban sample (66%) use social media for news, though this has declined from a peak of 73% in 2016. Online news is followed by TV (77%), printed media (46%), and radio (39%). However, the ranking and popularity of sources change when people were asked to choose their ‘main source’ of news in the last week. TV comes first at 48%, and online including social media (39%) follows. The shares of radio (7%) and printed media (6%) as main sources of news are very low.
Figure 4: Source of news in the last week
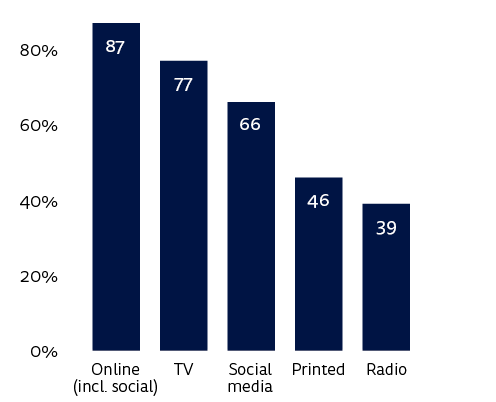
Q3. Which, if any, of the following have you used in the last week as a source of news? Please select all that apply.
Figure 5: Main news source
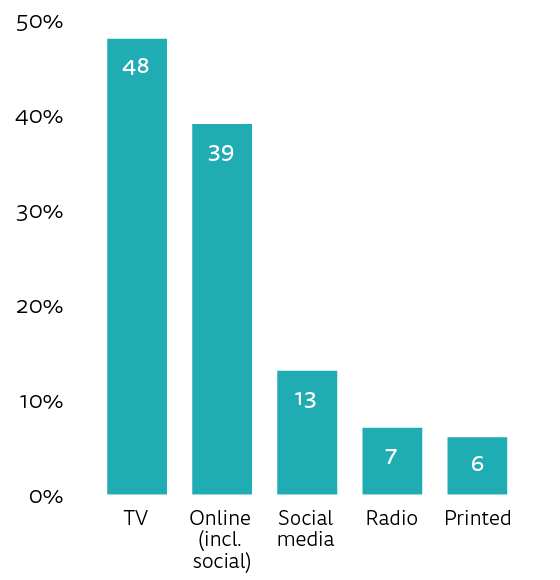
Q4. You say you’ve used these sources of news in the last week, which would you say is your MAIN source of news?
Online news including social media is much more widely used than TV, but it remains behind TV as the ‘main source’. While social media is cited frequently as a source of news, less than one-fifth see it as their main source at 13%. As to newspapers and radio, there is a significant difference between their ratings as a weekly, as opposed to main, news source. Very few people name them as their main source, but they are still widely used as one weekly source among many at 46% for print media (newspapers and magazines) and 39% for radio.
Figure 6: Source of news in the last week over time
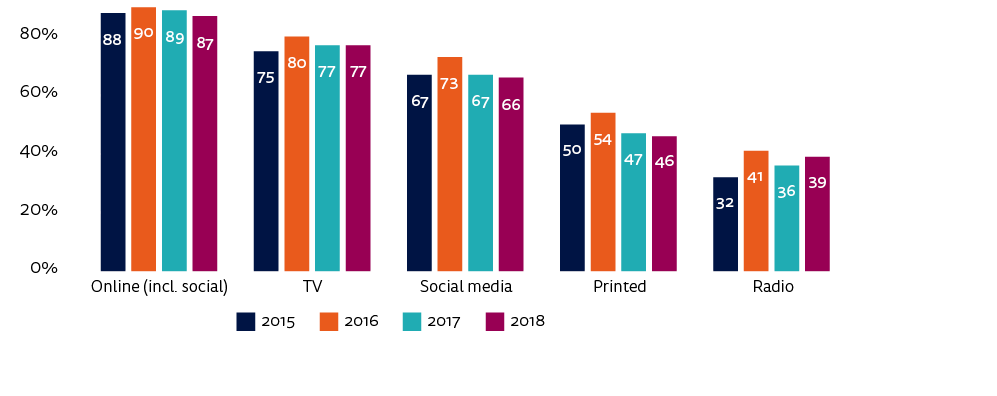
Q3. Which, if any, of the following have you used in the last week as a source of news? Please select all that apply.
When we compare the changes in recent years with 2018, we see a very stable position both in weekly use and main news sources. The popularity of TV, online news, social media, and print are almost unchanged, while radio increased only 3 percentage points in the past year as a weekly source. The gradual decline of printed media appears to stop this year.
Figure 7: Main source of news over time
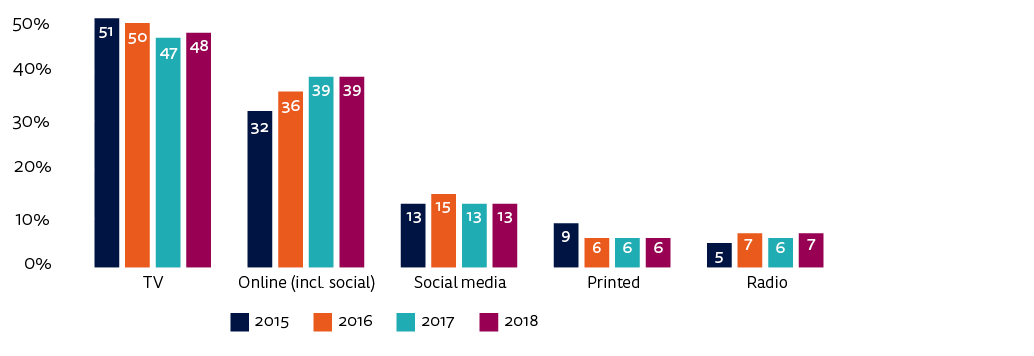
Q.4 You say you’ve used these sources of news in the last week, which would you say is your MAIN source of news?
While the changes are greater for the main source of news between 2015 and 2017, we see a stable situation in the past year. The remarkable rise of online media from 32% to 39% between 2015 and 2017 has stabilised in 2018. TV’s lead as the main source is 9 percentage points ahead of online.
The distribution of online media as the main news source deserves closer examination. We see that the share of digital-born news outlets (websites/apps of other news outlets) has not increased this year, at just 7%. Social media retained its largest share at 13% with no change compared with last year. The websites/apps of traditional sources, namely TV, newspapers, and magazines, still occupy an important place in this category. The share for websites/apps of newspapers is 9%, TV/radio is 7%, and news magazines is 1%.
Figure 8: Distribution of online news
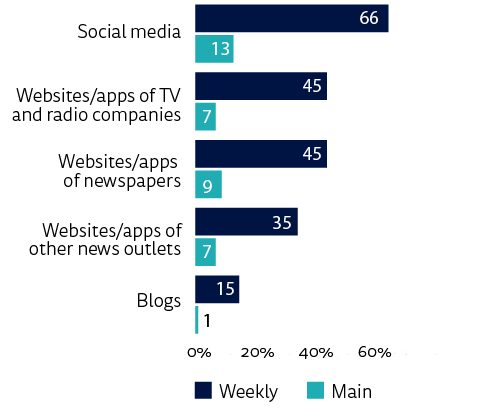
Q3. Which, if any, of the following have you used in the last week as a source of news? Please select all that apply.
Figure 9: Main news source and age
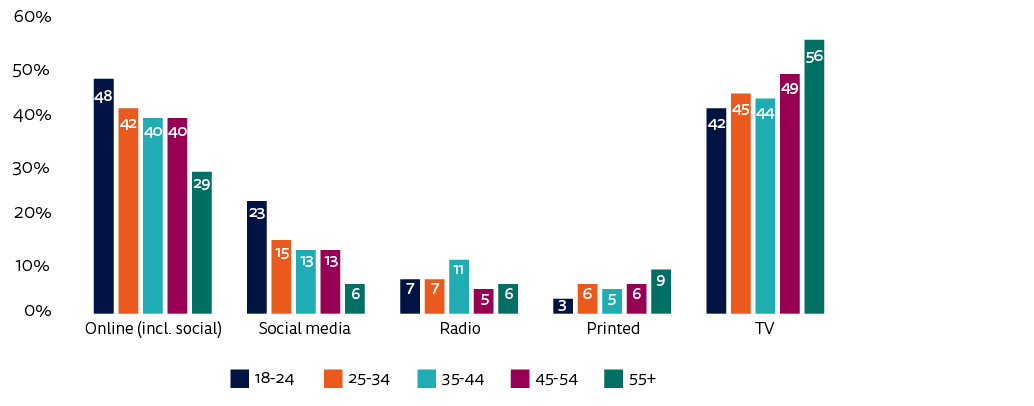
Q4. You say you’ve used these sources of news in the last week, which would you say is your MAIN source of news?
The relation between sources of news and age is very pronounced this year as younger people clearly preferred social and online media as their main news source compared with older audiences who preferred TV news (Yanatma 2017: 21–22). This reflects a general trend across countries; however, the variation by age in Turkey is not as strong as that in the average across all markets in the survey. There is a difference of 14 percentage points between 18–24-year-olds and those over 55 citing TV as their main source, and of 19 percentage points for online including social media. The difference between these two age groups is greater in social media where almost four times as many 18–24s cite this as their main source compared with the over 55s. We also see that online news is the primary source only for the 18–24 age group. While the differences between online and TV are not so great for the 25–44 age group (with around 4 percentage points in favour of TV), this difference rises among older respondents.
The main source of news varies strikingly by political leaning. Online media (45%) is the primary source for left-wing respondents whereas for those on the right it is TV (59%). High usage of online news and social media among left-wing respondents probably reflects the fact that they are seeking out more alternative viewpoints online since TV channels are largely controlled by the ruling party. There is also a great difference (22 percentage points) between those respondents on the right who cite TV as their main source as opposed to online media. The difference between the main sources cited by left- and right-wing participants is striking when comparing online and TV as main sources. The more right wing people are the more they prefer TV.
Figure 10: Main source of news by political leaning
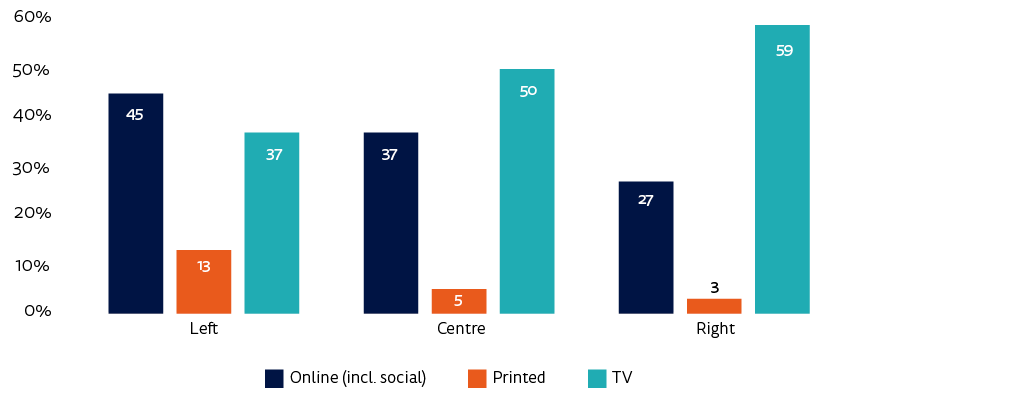
You say you’ve used these sources of news in the last week, which would you say is your MAIN source of news? Q1F. Some people talk about ‘left’, ‘right’ and ‘centre’ to describe parties and politicians. With this in mind, where would you place yourself on the following scale? Base: All able to answer if left/centre/right
2.2. Top Brands
Television channels clearly continue to dominate the offline brand list. Once again this year there are only two newspapers (Hürriyet and Sözcü) in the top ten. The main change is the critical Sözcü daily has an improved position this year. FOX TV, which is a Turkish prime-time channel, may owe its top position to its ability to criticise the ruling party. The 24-hour news channels, namely CNN Türk and NTV, still have a strong position in the list.
ATV, which is widely described as the mouthpiece of the ruling party, and the national broadcaster, TRT, which is a clear propaganda instrument of the government, have a strong audience too (Yeşil 2016: 116).
All in all, there are only three Turkish media outlets in the list that can openly criticise the ruling party. They are FOX TV, Cumhuriyet, and Sözcü.4 The others are largely seen as pro-government.
Figure 11: Top TV, print and radio brands
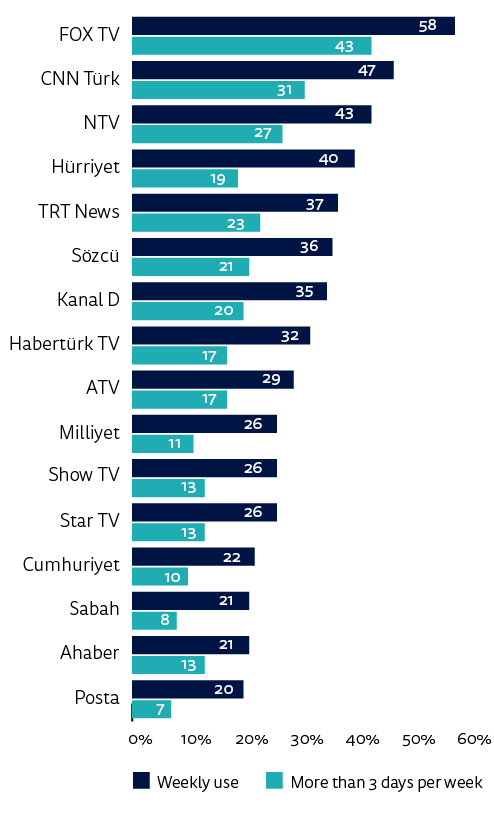
Q5a. Which of the following brands have you used to access news **offline** in the last week (via **TV, radio, print, and other traditional media)?** Please select all that apply. Base: All. Q5ai. You said you have used the following brands to access news offline in the last week… Which of these, if any, did you use on 3 days or more? Please select all that apply.
Figure 12: Top online brands
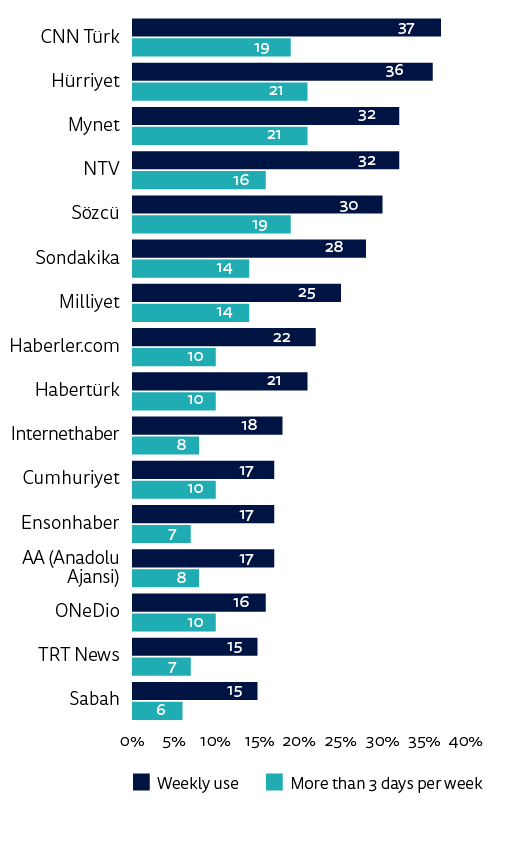
Q5b. Which of the following brands have you used to access news **online** in the last week (via **websites, apps, social media, and other forms of Internet access**)? Please select all that apply. Base: All. Q5bi. You said you have used the following brands to access news online in the last week… Which of these, if any, did you use on 3 days or more? Please select all that apply.
Websites/apps of traditional media, namely TV and newspapers, dominate the list of top online brands. The 24-hour news channels CNN Türk and NTV and dailies Hürriyet and Sözcü perform very strongly online. News aggregators, namely Mynet, Haberler, and Internethaber, kept their positions in the top ten. However, they do not generate their own news stories but republish stories from news agencies, newspapers, or TV. Therefore, the online sources of traditional media tend to dominate the list of top brands.
There is no digital-born news site in the list of top online brands that generates exclusive news stories and employs its own columnists. While the official Anatolia News Agency (AA) is in 13th position, its impact is more significant than this suggests. It distributes its news content including video and photos to those news organisations that subscribe. The agency also shares some of its news stories through its website and social media accounts and its stories are widely re-shared on social media.
The role of the agency has increased given that most media outlets depend on its news stories for various reasons. Firstly, the number of reporters at the other media outlets has dramatically decreased in recent years while the agency has a very large network of journalists. Secondly, media outlets feel more secure using content from the agency as it is perceived to be ‘approved information’.
3. News Consumption: Devices and Gateways
3.1. Devices Used
Smartphones and laptop/desktop computers are the most commonly used devices to access news, both as the main device and in terms of weekly reach. The most remarkable point is that the smartphone’s share as the main device continued to rise significantly, from 28% to 43% in three years, due mainly to the decline in computers, which fell from 55% to 42% in the same period. As a result, smartphones and computers are roughly level this year in terms of being identified as the main device.
Figure 13: Devices used
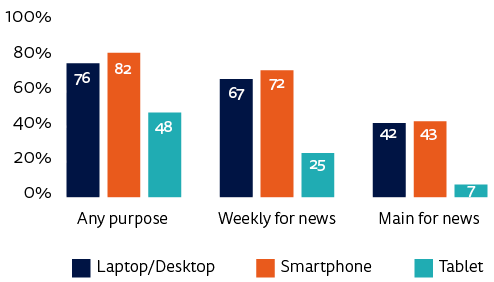
Q8A. Which, if any, of the following devices do you ever use (for any purpose)? Please select all that apply. Q8B. Which, if any, of the following devices have you used to access news in the last week? Please select all that apply. Q8b6_5. You’ve said you use the following devices to access news in the last week, which is your MAIN way of accessing online news?
* 2018 computer data may be overstated – see methodology for more information.
The figures may overstate the use of computers to access news on a weekly basis since respondents this year were only able to take the survey using a desktop or laptop computer.
Figure 14: Main news device to access news over time
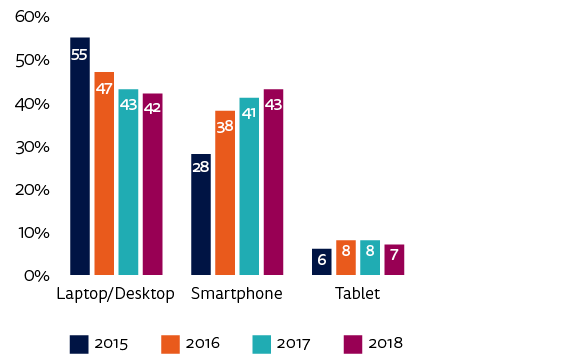
Q8b6_5. You’ve said you use the following devices to access news in the last week, which is your MAIN way of accessing online news?
Age is an important influence on the devices used to access news. The pattern across all 37 countries is that computers are used more by older people while younger generations predominantly use smartphones for accessing news. We see the same pattern in Turkey this year in the main devices used to access news. The younger the respondents the more they rely on smartphones to access news. In the 18–24 age group 53% use the smartphone as their main device whereas it is 31% for over 55s. Computer (laptop or desktop) usage is almost the mirror image of this ranging from 31% to 55%, with the older respondents making much more use than younger groups.
Figure 15: Main news device by age
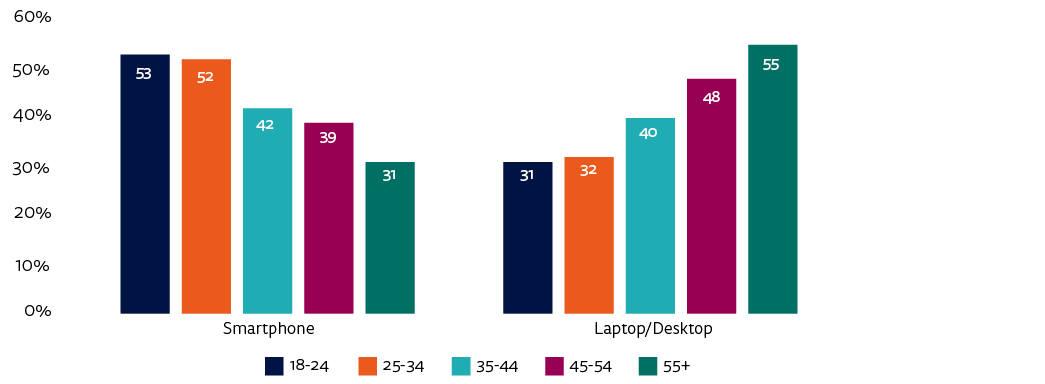
Q8b6_5. You’ve said you use the following devices to access news in the last week, which is your MAIN way of accessing online news?
3.2. Gateways
The most common gateway to online news in Turkey is search5 for both main and weekly access. When looking at weekly reach, social media (48%) and direct access (46%) lag behind search. A quarter of respondents access online news via mobile alerts, and it is 9 percentage points higher than the average of all countries. Email is less popular at 17% but this is ahead of the all-country average. The most striking finding is the much greater popularity of search in Turkey, which at 65% for weekly use is 21 percentage points higher than the average.
Figure 16: Gateways to online news in the last week
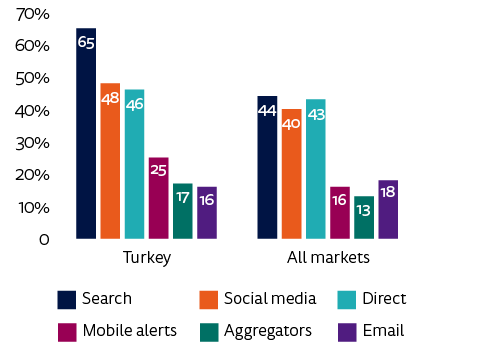
Q10. Thinking about how you got news online (via computer, mobile or any device) in the last week, which were the ways in which you came across news stories? Please select all that apply.
As to the main gateways, the clear majority of the respondents in Turkey (70%) access news through a side door (the total of access via search, social mobile alerts, aggregators, and email) rather than going directly to a news website or app. More than half (59%) prefer to get news through search engines, social media, or news aggregators, interfaces that use ranking algorithms to select stories, rather than interfaces driven by humans (homepage, email, and mobile notifications). The Turkish figures for accessing news through a side door and algorithms are both a few points higher than the average across all markets (65% and 53% respectively) (Newman 2018a: 14).
Figure 17: Main gateways to online news
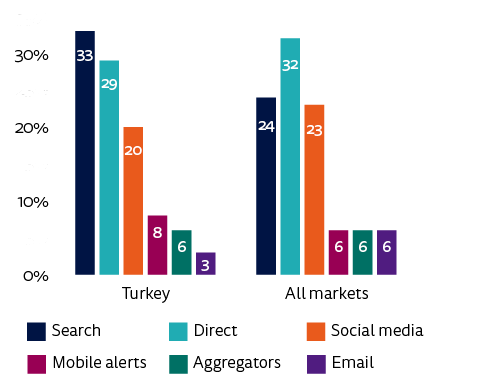
Q10a_new2017_rc. Which of these was the MAIN way in which you came across news in the last week?
Looking at the main gateways in more detail, search is the primary route at 33% in Turkey. Direct access and social media follow it at 29% and 20% respectively. The distribution of main gateways is more balanced in Turkey when compared with the average across the other countries, and a high reliance on social media is often a feature of countries with relatively low brand loyalty. As Newman points out, to illustrate, two-thirds of respondents in Finland (65%) and Norway (62%) prefer to go direct to a website or app. Elsewhere, preferred access is often via social media, with over four in ten preferring this route in Chile (43%), Bulgaria (42%), and Malaysia (40%). In some Asian countries, aggregators or search are the main gateways (Ibid. 15). There has been no significant change from 2017 in the distribution of main gateways in Turkey.
One of the main findings in the Digital News Report 2018 is that the fastest-growing gateway to news over the past three years has been mobile news alerts. This holds true in Turkey where mobile alerts are in fourth place among all countries by weekly access at 25%.
Figure 18: Main gateways to online news by age – TURKEY
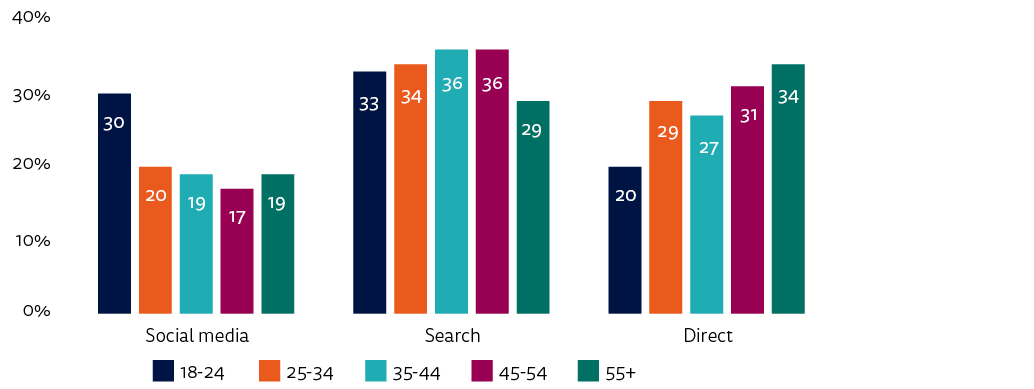
Q10a_new2017_rc. Which of these was the MAIN way in which you came across news in the last week?
Age plays a role in the main gateways to online news. For the over 55s, direct access is the primary route at 34% whereas search is the preferred gateway for other age groups. There is a striking difference between the under 25s and the older groups regarding social media and direct access. As elsewhere, social media (30%) is very popular among the youngest cohort (18–24), and direct access is less popular at 20%. There is almost no significant change among the over-25 age groups with very similar numbers choosing social media as their main source. We do see a gradual difference in direct access, with older groups preferring direct access, probably because of greater brand loyalty.
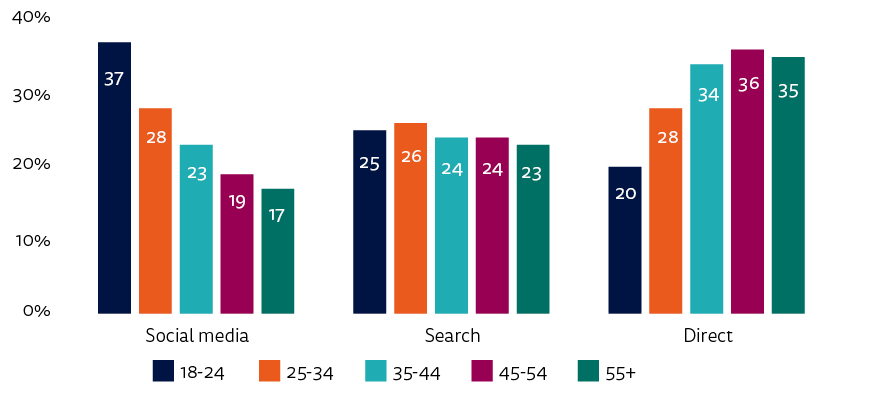
Figure 19: Main gateways to online news by age – ALL MARKETS
4. Trust and Polarisation in News Media
4.1. Trust in News
Declining trust in the media in recent years is noteworthy across many of the countries surveyed (Newman 2018: 17), and there is an ongoing global discussion on how to fight against misinformation and so-called ‘fake news’. Turkey is one of the countries at the centre of this issue, in part because of decreasing levels of media freedom and increasing political polarisation, which is reflected in the news media. While we avoid international comparison in terms of ranking among all markets, given that the countries in five continents in the survey have different media systems and political understanding, the high level of distrust in media in Turkey is striking and it shares the top position along with Greece, Bulgaria, and the USA.
As with last year, the most important point regarding the figures for overall trust and distrust in Turkish news media is that they are remarkably close to each other: 38% of people said that they trust most news most of the time, and 40% of people said they do not trust most news most of the time. The proportion who ‘neither agree nor disagree’ is 22%.
More significant, distrust is 2 percentage points higher than trust this year whereas trust was 2 percentage points higher than distrust in 2017.
As we underlined in last year’s report (Yanatma 2017: 30), one might expect lower trust levels in a country where the media are largely controlled by the government. But this ignores the fact that trust may be high among those who agree with the government, which seems to be the case in Turkey. Therefore, the phenomenon of similar trust and distrust scores can be attributed to the very polarised society and news media in the country. More detailed examination of the brand trust scores, news outlets, and political leaning in the remainder of this chapter will illustrate this polarisation.
While 38% of Turkish respondents trust news overall, this figure increases slightly to 43% when they are asked specifically about trust in the news they use. But it is still remarkable that only 43% of respondents trust the news that they use.
The share of those who ‘disagree’ with the propositions on trust thereby indicating distrust is also very significant. As noted the level of distrust in Turkey is very high at 40%. The proportion who ‘disagree’ with ‘trust in news I use’ is 33%. It is striking that 33% of respondents openly state that they distrust the news they use. All these figures are an indication of both distrust in news media and high polarisation.
Figure 20: Trust and distrust in news
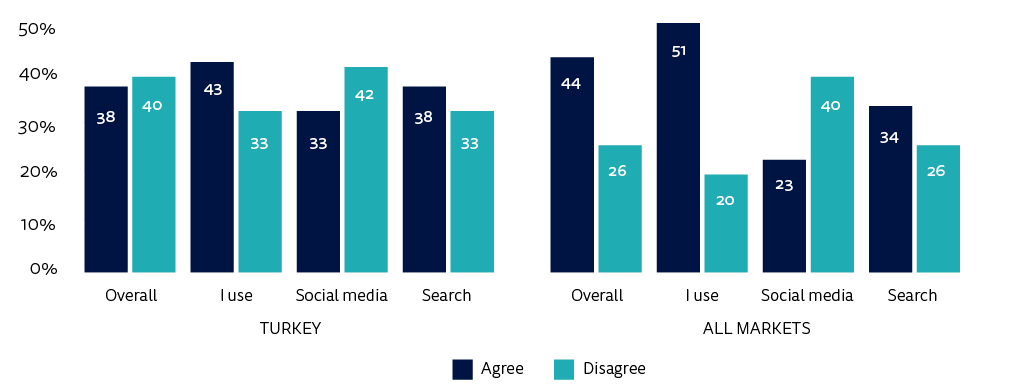
Q6_2018_1/2/3/4. Please indicate your level of agreement with the following statements. I think you can trust ‘most news’/’news I consume’/’news in social media’/’news in search engines’ most of the time.
Figure 21: Trust in news
Q6_2016_1. I think you can trust most news most of the time.
When we compare the trust results in Turkey with the average of all markets in the survey, we see that both trust in news overall and trust in the news ‘I use’ are lower in Turkey by 6 percentage points and 8 percentage points respectively. When it comes to distrust in news, the Turkish figures for news overall are 14 percentage points higher than the average of all markets, and 13 percentage points higher for distrust in news ‘I use’.
Furthermore, comparing the difference between trust and distrust in news in Turkey and the average of all markets provides a useful way to see the level of polarisation in news media in Turkey. The difference between overall trust and distrust is 2 percentage points, and it is 10 percentage points for news ‘I use’ in Turkey. However, in the average across all markets this difference is 18 percentage points and 31 percentage points respectively. We believe that the closer trust and distrust levels are the more news media is polarised.
This year, the survey included particular questions regarding trust in social media and search. In Turkey, trust in social media and search is high compared with the average of all countries in the survey, at 33% for social media and 38% for search. It is surprising that the levels of trust in news overall and in search are equal at 38% whereas one might expect lower trust levels for search as in the average across all markets. Similarly, there is a relatively high level of trust in social media, just 5 percentage points below the figure for trust in news overall. This might be attributed to the fact that people find social media freer and value it as a way of accessing alternative viewpoints.
Trust by political leaning is also revealing. Overall trust in news is higher on the right (51%) than the left (29%). Predictably it increases across all political orientations when respondents are asked about the ‘news I use’ with 59% on the right and 35% on the left. The reason why overall distrust in news (54%) is higher on the left than the right (32%) is likely due to a sense that the ruling party largely controls the media, and the very limited number of critical or impartial news media. Remarkably, the level of distrust in ‘news I use’ is also higher on the left (44%) than the right (24%). It seems that the underlying drivers of mistrust are linked with deep-rooted political polarisation and perceived mainstream media bias.
In addition, we see a very remarkable decrease in trust in news and increase in distrust on the left compared with 2017. In the past year overall trust in news declined 8 percentage points, and it fell 9 percentage points in the news that respondents use. In return, distrust increased 9 percentage points in news overall, and 8 percentage points in news that they use. We also notice a slight increase of 3 percentage points on the right in overall trust in news.
Figure 22: Overall trust in news by political leaning and age
Q6_2016_1. Some people talk about ‘left’, ‘right’ and ‘centre’ to describe parties and politicians. With this in mind, where would you place yourself on the following scale? Base: All able to answer if left/centre/right.
Figure 23: Trust in news ‘I use’ by political leaning and age
Q6_2016_6. I think I can trust most of the news I consume most of the time. Q1F. Some people talk about ‘left’, ‘right’ and ‘centre’ to describe parties and politicians. With this in mind, where would you place yourself on the following scale? Base: All able to answer if left/centre/right.
Age is also a significant driver of trust. In line with the global trend, the youngest respondents have the lowest level of trust in news overall, with just 28% in the 18–24 age group whereas it is 43% for over 55s. The same applies to trust in the ‘news ‘I use’, where the older the respondents the higher the trust, with a variation of 12 percentage points between the youngest and oldest age groups. We have seen that older respondents have stronger brand loyalties. Higher trust in news that they use for the older people may reflect established political loyalties and hence correspondingly high levels of trust in media outlets that are aligned with those.
4.2 Brand Trust Scores and Polarisation in News Media
This year, besides general trust in news, the survey explores the trust that respondents place in specific news brands. Respondents were asked to indicate their trust in selected news brands, on a scale of 0 (completely untrustworthy) to 10 (completely trustworthy). The question also included the option of choosing ‘I have not heard of this brand’. As expected, trust by people who have heard of the brand and those who use it varies. We see that the type of media source, such as TV, print, and digital born, does not seem to determine the level of trust in both categories.
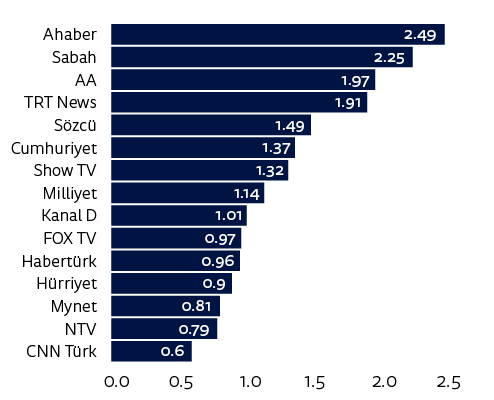
Looking at trust by people who have simply heard of the brand, the degree to which brands are seen as being pro-government in their coverage seems to be the decisive factor in this category. The brands that operate as the mouthpiece of the ruling party are placed at the bottom, with the pro-government ones just above.6 For instance, the only two brands rated below 5 points are Ahaber news channel and Sabah daily, which both belong to the same media group, Turkuvaz, which is largely known as the mouthpiece of the ruling party (Yesil 2016: 116). Public broadcaster TRT and the official Anatolian News Agency (AA) also have lower trust scores. FOX TV, which takes a more critical line, is at the top. The dailies Cumhuriyet and Sözcü, which are severely critical of the ruling AK party, are in the top five places as well.
Figure 24: Brand trust scores (0–10)
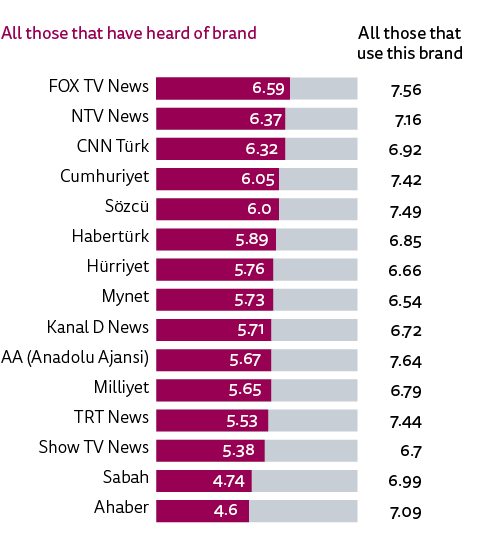
Q6_2018. How trustworthy would you say news from the following brands is? Use the scale below, where 0 is ‘not at all trustworthy’ and 10 is ‘completely trustworthy’.
On the other hand, figures for trust by people who have used each brand give a very different picture as the outlets with a clear political stance, whether that is pro-government or highly critical, have better scores. The AA scores best and TRT is in fourth place when measured in this way. The critical outlets Sözcü and Cumhuriyet share fifth place. FOX TV keeps its strong position and comes second in this category as well.
The detailed analysis of brand trust score by those who have heard of the brand provides a powerful picture of polarisation in the news media. We have looked at the proportion of ‘not at all trustworthy (0)’ scores for each brand in the survey, as scoring ‘0’ indicates that people consciously avoid using news from these brands. There are a few brands that clearly elicit some very negative feelings.
Figure 25: Proportion of that scored ‘Not at all trustworthy (0)’
Q6_2018. How trustworthy would you say news from the following brands is? Use the scale below, where 0 is ‘not at all trustworthy’ and 10 is ‘completely trustworthy’. Base: Those who have heard of the brand.
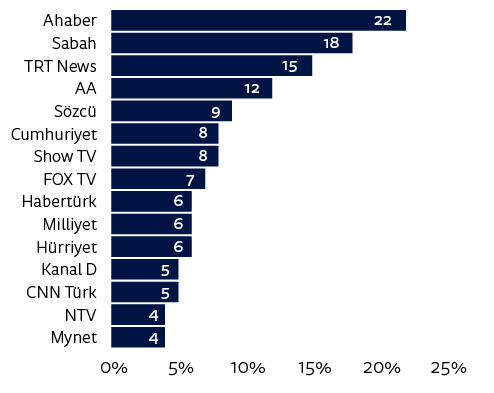
Taking a clear political stance has an impact on the level of ‘0’ scores. This can apply whether coverage is either pro-government or critical of the ruling party. Once more, Ahaber and Sabah are at the top of the list. In the survey 22% of respondents scored Ahaber as ‘not at all trustworthy’ indicating that over one-fifth of respondents never trust this brand. TRT and AA are next. The dailies Sözcü and Cumhuriyet, which are very critical of government, follow those, but their percentage is lower.
The difference in the trust scores between those who have used versus those who have heard of the brands provides an insight into another aspect of media polarisation. It is not surprising that the top six brands in this ranking are identical with those having the highest scores for being ‘not at all trustworthy (0)’. The greater the difference between trust by those who had ‘used’ as opposed to simply ‘heard’ of brands, the more they tend to have a clear political stance in their coverage. There is a particularly high level of polarisation among media brands that operate as mouthpieces of the ruling party.
Figure 26: Trust difference between ‘used’ and ‘heard of’ brands
Q6_2018. How trustworthy would you say news from the following brands is? Use the scale below, where 0 is ‘not at all trustworthy’ and 10 is ‘completely trustworthy’. Base: Those who have used/heard of the brand.
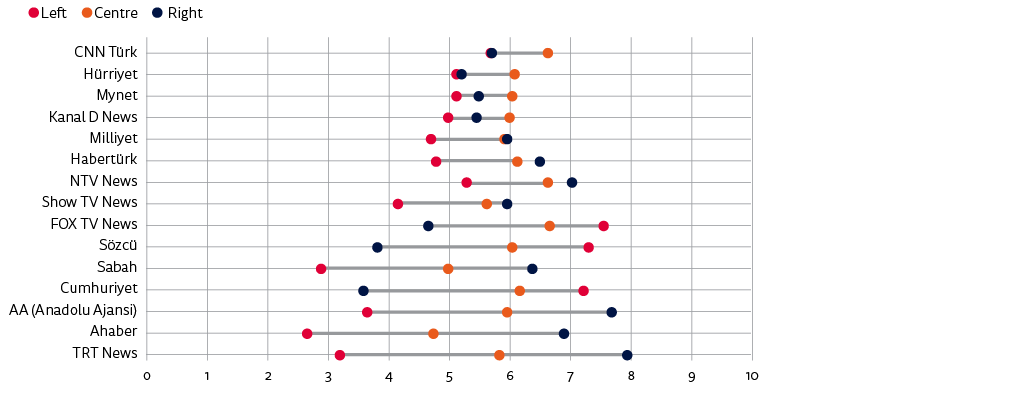
We can also look at the brand-level trust scores through a political lens. In this chart, the trust scores of those who self-identify on the right are represented by blue dots, those from the left by red dots, and those in the centre by orange dots. The wider gaps between the right and the left shows the partisan trust. We see strong differences in brand trust according to different political leanings, especially for half of the brands analysed. TRT Haber, Ahaber, Anadolu Ajansı, and Sabah have much higher levels of trust from those on the right (represented by the blue dots) whereas Cumhuriyet, Sözcü, and FOX TV show the reverse. Those on the right give TRT Haber a score of 8.0, with left-leaning respondents rating the public broadcaster just 3.2. Sözcü gets a high rating from the left (7.3) and a low one from those on the right (3.8). Ahaber is also well trusted on the right (6.9) but those on the left give it a score of less than 3 (2.6).
Left-leaning respondents (marked in red on the chart) strongly distrust many of the news brands such as TRT Haber, Ahaber, Anadolu Ajansı, and Sabah. Right-leaning respondents show similarly low levels of trust in two brands, the Sözcü and Cumhuriyet dailies. The least polarising brands are CNN Türk, Hürriyet, and Mynet. It indicates that these media outlets are seen to adopt a relatively reasonable approach compared with the ones having a clear political stance whether on the right or left. However, this is a relative perception, which does not necessarily mean that these brands provide well-balanced and fair coverage.
Figure 27: Average level of trust in news brands by political leaning
Q1F. Some people talk about ‘left’, ‘right’, and ‘centre’ to describe parties and politicians. With this in mind, where would you place yourself on the following scale? Q6_2018. How trustworthy would you say news from the following brands is? Use the scale below, where 0 is ‘not at all trustworthy’ and 10 is ‘completely trustworthy’. Base: Left /Centre/Right.
Note: People who indicated that they have not heard of a brand were excluded.7
5. Misinformation, ‘Fake News’, and News Literacy
5.1. Misinformation and ‘Fake News’
With Turkey being one of the countries with the most polarised politics and news media, misinformation has been a key issue in recent years. As the country experienced both a historic referendum giving the President sweeping new powers in 2017 and the first election under this new political system in 2018, misinformation and so-called ‘fake news’ have been at the centre of political debates. That may help explain the growth of some credible fact-checking organisations in Turkey.8
This year’s survey measured people’s self-reported exposure to the different forms of misinformation that trigger public concern. As Fletcher underlines, exposure is clearly much harder to measure than concern ‘because in some cases it relies on people’s ability to correctly identify information that has been deliberately designed to be misleading, and because what exactly constitutes misinformation is partly subjective’ (Fletcher 2018a: 39). Respondents were asked which types of misinformation they have personally come across in the last week.
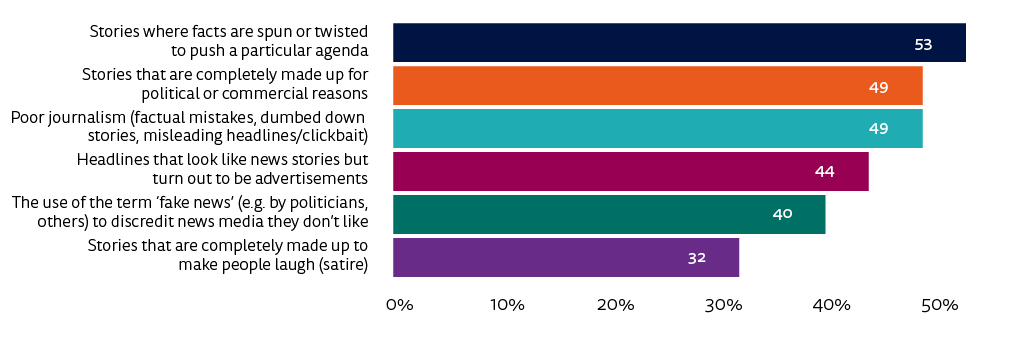
‘Stories where facts are spun or twisted to push a particular agenda’ at 53% is placed at the top in this question. After Greece and Croatia, Turkey is in third place along with Bulgaria and Hungary. More importantly, 49% of respondents stated that they have come across ‘stories that are completely made up for political or commercial reasons’. This places Turkey at the top of the list for this compared with the average of all countries of 26%.
Meanwhile, as is explained in the methodology section and should be clear from the wording of the question, the survey does not set out to calculate the amount of ‘fake news’ in Turkey. Respondents were asked ‘which of the following have you personally come across’ in the last week, and one of the choices was ‘stories that are completely made up for political or commercial reasons’. The figures therefore simply reflect the level of exposure reported by respondents, not the amount of ‘fake news’. We are also aware that exposure is clearly hard to measure since ‘it relies on people’s ability to correctly identify information’ (Ibid. 39).9
Figure 28: Proportion who say they were exposed to each type of misinformation – TURKEY
Q_FAKE_NEWS_3. In the LAST WEEK which of the following have you personally come across? Please select all that apply. Base: Those who expressed exposure.
Figure 29: Proportion who say they were exposed to completely made-up news in the last week – ALL MARKETS
Q_FAKE_NEWS_3. In the LAST WEEK which of the following have you personally come across? ‘Stories that are completely made up for political or commercial reasons.’ Base: Those who expressed exposure.
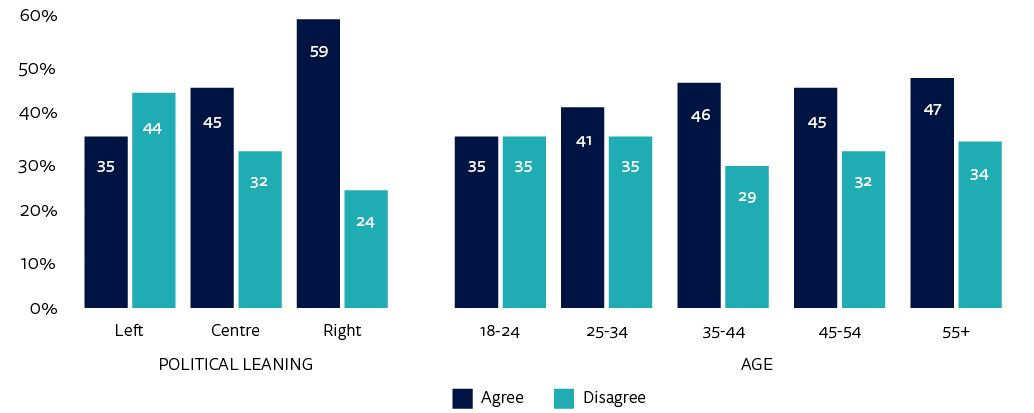
Figure 30: Proportion who say they were exposed to completely made-up news by political leaning
Q_FAKE_NEWS_3. In the LAST WEEK which of the following have you personally come across? Stories that are completely made up for political or commercial reasons. Base: Those who expressed exposure. Q1F. Some people talk about ‘left’, ‘right’ and ‘centre’ to describe parties and politicians. With this in mind, where would you place yourself on the following scale? Base: All able to answer if left/centre/right.
One might expect people who are critical of the Turkish government to be most likely to report exposure to completely made-up news because of disquiet at the ruling party’s control of large parts of the media. Response by political leaning confirms this with 59% of left-wing respondents reporting such exposure. However, a large number of those in the centre and on the right also reported being exposed to completely made-up news, at 49% and 48% respectively. We cannot be sure about what they had in mind but it seems likely that people supporting the opposition parties were mostly referring to the coverage of pro-government media whereas the supporters of the ruling party were thinking not only of the critical online news media but also posts by activists on social media.
When concern over or exposure to misinformation is high, it raises the question of who should work to combat it. Our survey asked people whether they thought that media companies, technology companies, or government should do more to separate what is real and what is fake on the internet. In Turkey, 78% of respondents thought that media companies and journalists should do more, with 76% choosing technology companies like Facebook and Google. Also, 68% said that government should do more to separate what is real and what is fake on the internet. This very high figure in such a polarised society may appear surprising but reflects the tradition of a strong central state in Turkey, although it is interesting that people on the right are even more inclined to agree with this (84%) than those on the left (65%) or in the centre (69%).
Figure 31: Proportion who agree that each should do more to separate what is real and what is fake on the internet
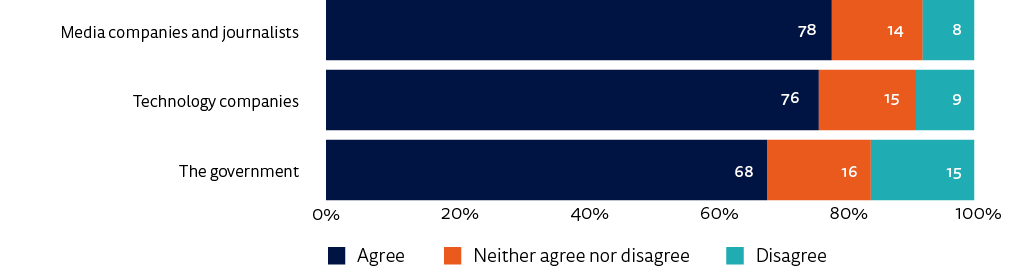
Q_FAKE_NEWS_4_2_1-3. Please indicate your agreement with the following statements. Technology companies/media companies/the government should do more to make it easier to separate what is real and fake on the internet.
5.2. News Literacy
Richard Fletcher points out that ‘discussions over misinformation, disinformation, and “fake news” have reignited interest in news literacy’ (Fletcher 2018b: 34)10 in recent years. Therefore, the survey includes questions to measure the level of news literacy in each country. In this research, news literacy ‘refers to knowledge about how the news is made: who makes it, how it is selected, and how it is financed’ (Ibid.). Respondents were asked three factual questions on different dimensions of how news is made. We are aware that ‘three questions cannot accurately measure exactly how knowledgeable a person is about an issue as complex and multifaceted as news production’ (Ibid.). Still, it provides very useful data to understand news literacy knowledge levels of respondents. On the other hand, we should underline that this data represents urban Turkey as the survey was conducted online, and the education level of our respondents was very high.
Figure 32: Which of the following news outlets does NOT depend primarily on advertising for financial support?
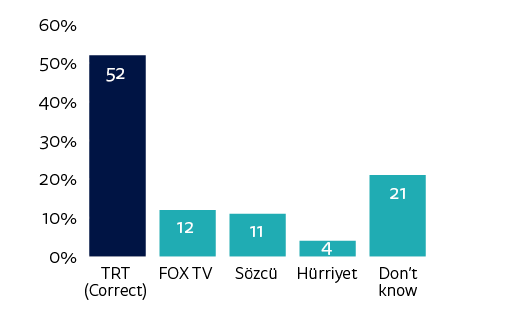
Q14_2018a. Which of the following news outlets does NOT depend primarily on advertising for financial support.
The first and basic question aimed to identify the public broadcaster from a list of television and print outlets that depend primarily on advertising for financial support. In the survey 52% of respondents answered this question correctly. It is 4 percentage points higher than the average of all countries in the survey.11
More than 90% of the public broadcaster Turkish Radio Television’s (TRT) funding comes from a tax levied on electricity bills and licence fees (Kaplıca 2014). All electricity consumers in Turkey contribute 2% of their bills to TRT (Anatolian News Agency 2017), and this amount is clearly visible on the bills. This law is regularly criticised by the opposition parties as the coverage of TRT has become more and more pro-government in recent years. Therefore, it is well known that TRT is publicly funded in Turkey.
Figure 33: Which of the following is typically responsible for writing a press release?
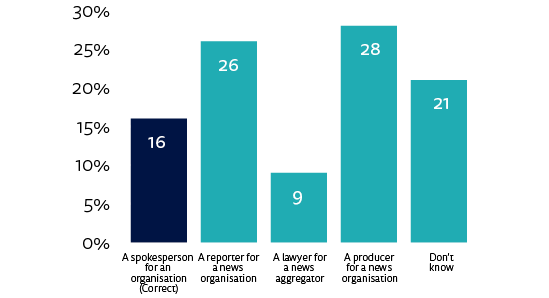
Q14_2018b. Which of the following is typically responsible for writing a press release?
The second question asked respondents who they thought was typically responsible for writing a press release. Only 16% of respondents answered this correctly whereas the average of all countries is 26%.
Figure 34: How are most of the individual decisions about what news stories to show people on Facebook made?
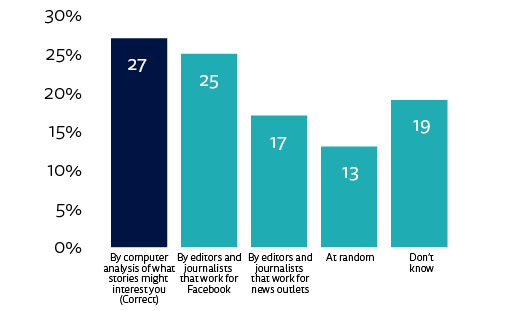
Q14_2018c. How are most of the individual decisions about what news stories to show people on Facebook made?
The third question asked about how news is selected on social media. It is a significant question in a time that social media has emerged as an important source of news. It has increasingly become an alternative platform for news as the government has largely taken control of Turkish media. In line with the average of all markets, 27% of respondents correctly stated that most of the individual decisions about news people see on Facebook are made by computer analysis of what stories might interest them.
Figure 35: News literacy scale based on number of correct answers
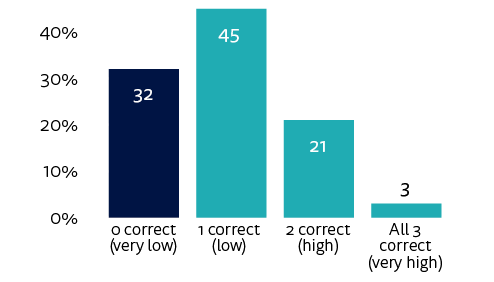
Q14_2018a_combined2. News literacy scale.
We see that one-third (32%) did not get any of these questions correct: 45% of respondents answered one question correctly, and 21% two questions. Only 3% answered all three questions correctly. When we look at the relationship between news literacy level and other variables, we see that age and gender do not impact much on these scores. However, as expected, news literacy increases among the more educated and more affluent respondents. People with higher levels of news literacy also tend to consume news from a wider range of sources.
6. Social Media Messaging and Participation
6.1. Top Social Media and Messaging for News
The Digital News Report 2018 explores the rise in the use of messaging apps for news and how this is related to the decline in use of Facebook for news. The international report reveals that more people have been using messaging apps such as WhatsApp for any purpose (44%), while average usage for news has more than doubled to 16% in four years. It also shows that the use of Facebook for news has been falling since 2016 in many countries (Kalogeropoulos 2018: 51).
The global trend generally holds true in Turkey, but with an even larger number of respondents preferring to share news or talk privately by instant messenger (32% versus 17% for the international average) instead of doing so publicly. The sharp downturn in the use of Facebook and the rise of closed messaging for news may be related to fears about government surveillance, as Turkey is at the top among all countries in the proportion stating concern that openly expressing their political views online could get them into trouble with the authorities.
Figure 36: Proportion that used each social network for any purpose in the last week
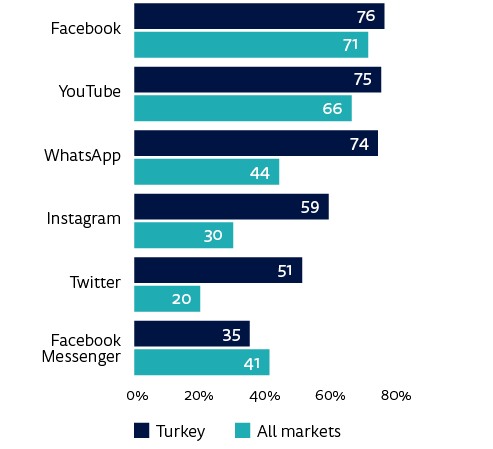
Q12A. Which, if any, of the following have you used for any purpose in the last week? Please select all that apply.
Figure 37: Proportion that used each social network for news in the last week
Q12B. Which, if any, of the following have you used for finding, reading, watching, sharing, or discussing news in the last week? Please select all that apply.
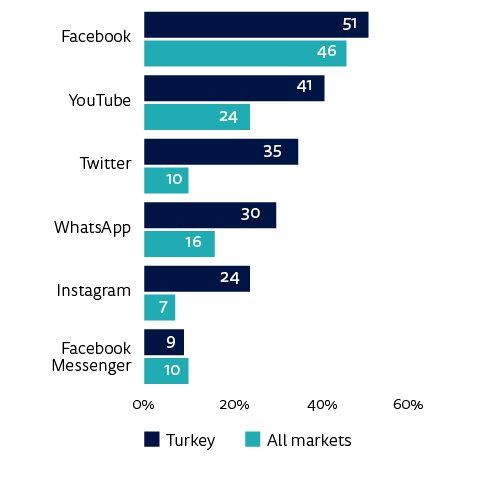
We see that all social media networks and messaging applications are more popular in Turkey than the average of all markets (except Facebook Messenger for any purpose). In terms of using social networks for any purpose in the last week, several of them are very popular. Twitter is used more than twice as much in Turkey (51%) than the average across all countries (20%). Instagram is also twice as popular in Turkey (59%) than all countries (30%). For WhatsApp in this category, use in Turkey at 74% is 30 percentage points ahead of the average for all markets (44%).
As for the use of social networks and messaging apps for news, almost all of them are used far more in Turkey than the average of all countries (except Facebook Messenger with only 1 percentage point margin). The difference is particularly pronounced in the use of WhatsApp, Twitter, Instagram, and YouTube for news. WhatsApp use for news is 30% in Turkey whereas the average in the survey is 16%. Twitter for news in Turkey is 35% while for all countries is just 10%. The use of Instagram for news is also increasing in Turkey at 24% whereas it is 7% in all countries.
Figure 38: Top social media and messaging for news over time
Q12B. Which, if any, of the following have you used for finding, reading, watching, sharing, or discussing news in the last week? Please select all that apply.
It can be hard to separate social networks from messaging applications (Ibid. 51). While Twitter and Instagram are not primarily messaging applications, they have messaging built into their service. Our survey does not include any questions on this issue, but we think that these social networks, namely Twitter and Instagram, are increasingly used for messaging in Turkey.
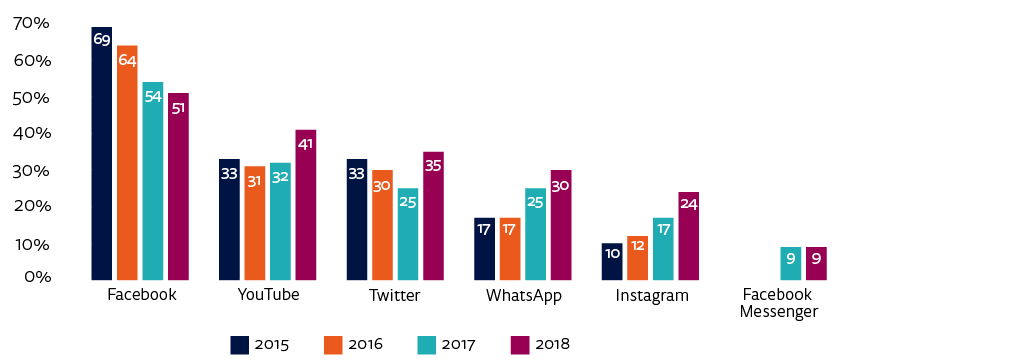
When we look at the change over time in use of these social networks and applications for news, we see a striking decrease in Facebook of 18 percentage points in three years. After declining in the past two years, the use of Twitter for news increased by 10 percentage points this year. Turkey is easily at the top of the list among the 37 countries in the use of Twitter for news. The gradual increase of Instagram is also remarkable given that it rose 14 percentage points in three years. We do not see any change in the use of Facebook Messenger since last year.
As with last year, there is another striking rise in the use of the closed messaging service WhatsApp, up by 5 percentage points. It is probably linked to a climate where it is unsafe for people, especially state employees, to criticise the government on social media so people use more secure messaging apps for sharing news. Turkey is in second place among European countries in the use of WhatsApp for news, behind Spain (36%), and tenth place across all markets. The significant point is that use of WhatsApp for news is very low in Western countries whereas it is very high in Latin American countries (Brazil 48% and Argentina 37%) and some Asian territories (Malaysia 54% and Singapore 42%).
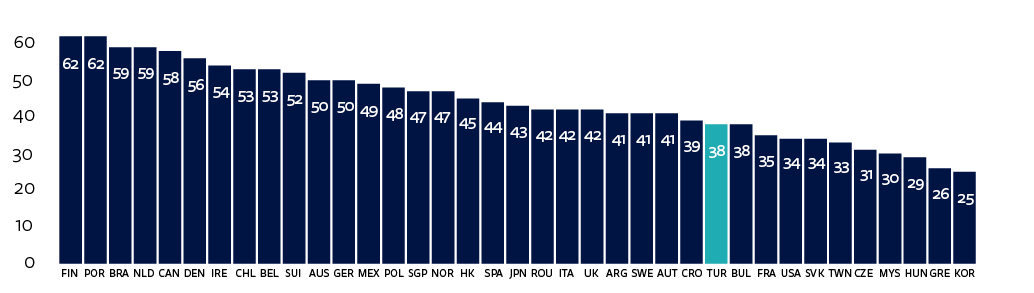
Figure 39: Proportion concerned that openly expressing their political views online could get them into trouble with the authorities – ALL MARKETS
Q13a_2018_1.Please indicate your level of agreement with the following statements. ‘I tend to think carefully about expressing my political views openly on the internet because this could get me into trouble with the authorities’.
Figure 40: Self-expressed concern about the safety of posting political messages and use of WhatsApp for news
Q13a_2018_1. Please indicate your level of agreement with the following statements. ‘I tend to think carefully about expressing my political views openly on the internet because this could get me into trouble with the authorities’. Which, if any, of the following have you used for finding, reading, watching, sharing, or discussing news in the last week?
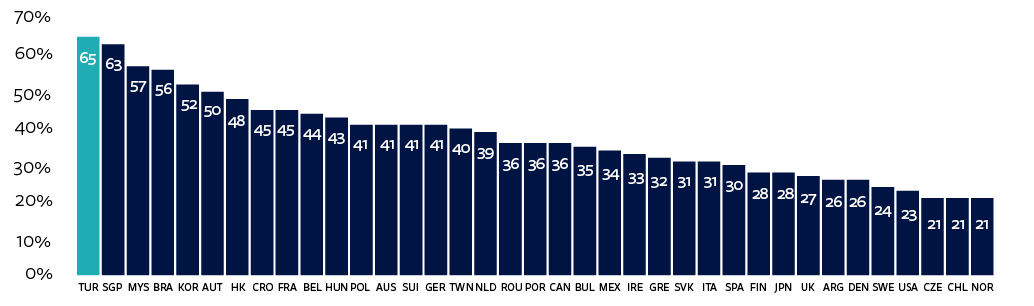
Turkey is at the top in the proportion concerned that openly expressing their political views online could get them into trouble with the authorities: 65% of respondents think this whereas the average for all countries is 37%. This is unsurprising since hundreds of people were prosecuted in Turkey because of their shares and comments on social media. More importantly, the latest state of emergency decree lists social media posts among the reasons justifying dismissal from state employment (Ahval News 2018; the Guardian 2018).
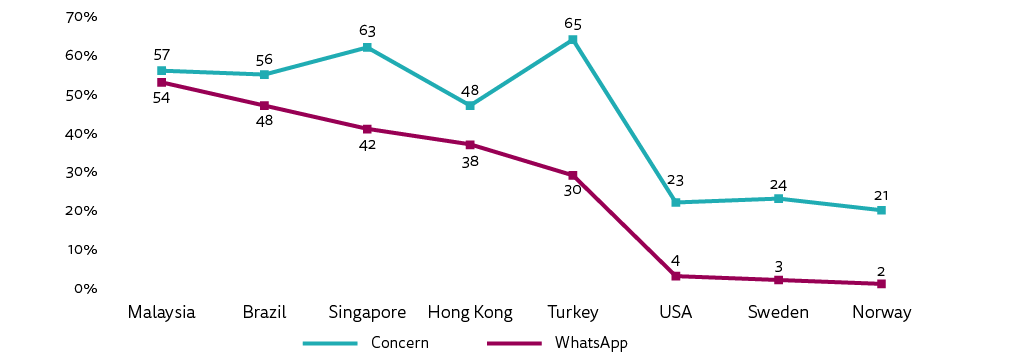
The Digital News Report 2018 finds a strong correlation between use of networks like WhatsApp for news and self-expressed concern about the safety of posting political messages. Users in some ‘less free’ countries are more likely to think carefully before expressing their political views online. Newman points out that a safe place for free expression has been one factor driving the rapid growth of messaging apps in markets like Turkey, Malaysia, and Hong Kong. He explains the case of Turkey as follows: ‘In a country that the US NGO Freedom House recently labelled “not free” for the first time, encrypted messaging apps like WhatsApp have proved a relatively safe way to express political views.’ (Newman 2018a: 13)
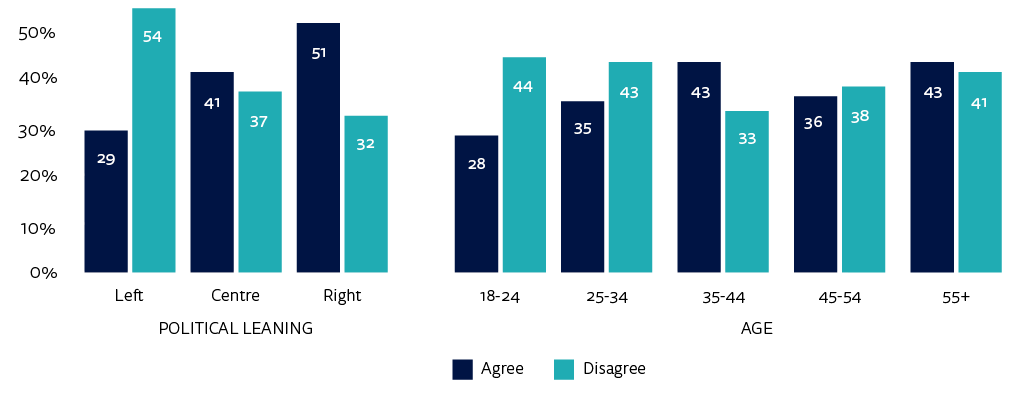
Figure 41: Concerned that openly expressing their political views online could get them into trouble with the authorities by political leaning
Q13a_2018_1. Please indicate your level of agreement with the following statements. ‘I tend to think carefully about expressing my political views openly on the internet because this could get me into trouble with the authorities’. Q1F. Some people talk about ‘left’, ‘right’ and ‘centre’ to describe parties and politicians. With this in mind, where would you place yourself on the following scale? Base: All able to answer if left/centre/right.
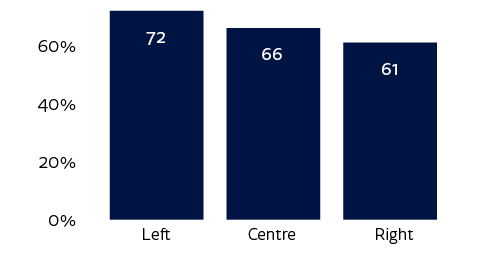
At first glance one might think that people who are the most critical of the government would be more concerned that openly expressing their political views online could get them into trouble with the authorities. While it is true that respondents on the left (72%) are slightly more concerned, the scores for the centre and right are also very high at 66% and 61% respectively. These figures show that it is not only those respondents who support the opposition parties but all parts of society that are concerned.
6.2. Participation: News Sharing and Commenting
News sharing and commenting in any way, including social media, face to face, or email, is particularly high in Turkey: 56% of respondents share news and 44% of respondents comment on news in Turkey compared with 39% and 25% respectively across all markets. The political leaning of Turkish respondents has no noticeable impact on the level of news sharing and commenting.
Figure 42: Overall news share and comment
Q13. During an average week in which, if any, of the following ways do you share or participate in news coverage? Please select all that apply.
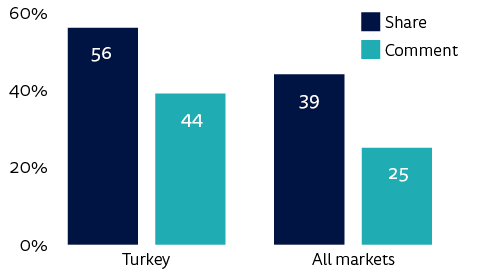
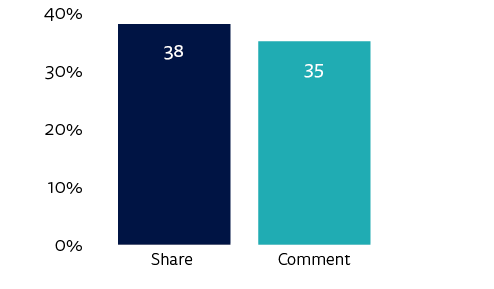
It is striking that, while Turkey is at the top of the countries covered in the report for self-expressed concern about the safety of posting political messages, sharing or commenting on a news story via a social network (e.g. Facebook, Twitter, LinkedIn) is also very high in Turkey, with 38% for sharing and 35% for commenting compared with 26% and 20% respectively in all countries. And in the area where one might expect most concern, namely commenting on a news story via a social network, Turkey is in the lead across all 37 countries. The gradual decline over time in commenting stopped this year. After an 8 percentage point fall in the previous two years, commenting has risen 4 percentage points this year. Once again there is no significant difference in commenting by political leaning; it is 41% on the left, 42% on the right, and 35% in the centre. It would seem that sharing and commenting is used not only to criticise the government, but also to support it too.
Figure 43: Share or comment on a news story via social network
Q13. During an average week in which, if any, of the following ways do you share or participate in news coverage? Please select all that apply. Base: Share/comment on a news story via social network (e.g. Facebook, Twitter, LinkedIn).
7. Conclusion
The sale of Turkey’s largest media conglomerate to a pro-government businessman is undoubtedly one of the critical developments in Turkish media in the past decade. It was described by Reporters Without Borders’ Turkish representative as marking ‘the death of pluralism and independent journalism’ in Turkey’s mainstream media (Butler and Toksabay 2018). As online news, including social media, has increasingly become an alternative platform for news, the government has also intensified its pressure on online media. The broader political atmosphere impacts on behaviour online and helps explain why Turkey is at the top of the 37 countries in terms of the proportion of people concerned that openly expressing their political views online could get them into trouble with the authorities. The rise in use of messaging applications for news is another aspect of this trend. The political environment will continue to influence the online media landscape in coming years.
The high level of distrust in news is also remarkable in Turkey as it is higher than trust, showing the extent of media polarisation. The respondents seem to be divided into two camps in trusting or distrusting news media. In addition, half the respondents said that they were exposed to completely made-up news in the last week, placing Turkey at the top of the 37 countries.
The role of digital-born news media is still not particularly strong and the websites or mobile applications of televisions and newspapers occupy the top places in the online brand list. Small-scale online news platforms face both political and financial pressures. On the financial side, while digital advertising has generally increased significantly in recent years, the share going to these digital-born news platforms is very limited. Donations and crowdfunding could potentially provide an alternative but are not widespread in Turkey and so far only a few individual journalists have made use of them. External international donor funds and those from the European Union will be insufficient to support high-quality independent journalism in Turkey. Independent digital-born media will need to persuade their audience to pay directly for online news, whether through subscription, membership, or donations.12 However, they may meet reluctance because of fears of government surveillance.
1 His show regularly reaches around 45,000 people with broadcasts across all digital platforms. Personal conversation with Ünsal Ünlü, March 2018.
2 To illustrate, his show on the Turkish presidential election results has been accessed more than 670.000 times. https://www.youtube.com/watch?v=ruDDKcpbeb0
3 See ‘Searching for online media business models in Turkey,’ International Journalism Festival 2018. https://www.journalismfestival.com/programme/2018/searching-for-online-media-business-models-in-turkey.
4 While there are some critical media, organisations such as Cumhuriyet and Halk TV have a limited audience, and all of them live under constant threat of prosecution and jail, which encourages self-censorship.
5 Search includes ‘used a search engine (e.g. Google, Bing) and typed in a keyword about a particular news story or a keyword for the name of a particular website’.
6 We should remember that this survey was carried out before the crucial sale by Turkish media mogul Aydin Dogan of all his media outlets to Demirören Holding, a pro-government conglomerate, in April 2018.
7 The author would like to thank Dr Antonis Kalogeropoulos, Research Fellow at the Reuters Institute for the Study of Journalism, for his assistance with this chart.
8 It may seem surprising in a country with a deeply polarised society and news media, but the fact-checking organisation Teyit.org has a very good reputation among all parts of society. Both the authorities and supporters of the ruling AK party and opposition parties cite its findings. Another organisation, Doğruluk Payı, which checks the accuracy of political statements, also plays a significant role in this context.
9 When the Reuters Institute Digital News Report 2018 was released in June 2018 there was widespread misreporting (and subsequent sharing on social media) that our results showed that one in two news stories in Turkey were fake, but this is not a subject of the survey, and the report includes no such finding. For a discussion of this coverage see Foça 2018.
10 In this chapter, we use the news literacy model developed in Reuters Institute Digital News Report 2018.
11 The average of all countries does not include Brazil, Argentina, Chile, and Mexico regarding the three news literacy questions.
12 30% of Turkish respondents said that news organisations should ask for donations from the public if they could not cover their costs in other ways, compared with 22% across all our 37 countries, with higher figures in Turkey from those on the left. However, it is unclear how likely they might be to do this in practice. In other countries without concerns about surveillance there is a substantial difference between those currently donating and those who say they might be prepared to do so in the future (Newman 2018b: 48).
References
Ahval News. 2018. ‘Latest Decree Shows Social Media Posts among Reasons for Dismissal’, 8 July, https://ahvalnews.com/turkey/latest-decree-shows-social-media-posts-among-reasons-dismissal. (Accessed Sep. 2018)
Akdeniz, Y. 2018. ‘Analysis of the Draft Provision on the “Presentation of Media Services Via Internet” to the Turkish Law No. 6112 on the Establishment of Radio and Television Enterprises and Their Media Services’, February, https://www.osce.org/representative-on-freedom-of-media/373846?download=true. (Accessed Apr. 2018)
Anatolian News Agency. 2017. ‘Industrialists to No Longer Fund Turkey Broadcaster TRT’, 10 May, https://www.aa.com.tr/en/turkey/industrialists-to-no-longer-fund-turkey-broadcaster-trt/815799. (Accessed Sep. 2018)
Butler, D. and Toksabay, E. 2018. ‘Sale of Dogan Set to Tighten Erdogan’s Grip over Turkish Media’, Reuters, 22 March, https://www.reuters.com/article/us-dogan-holding-m-a-demiroren/sale-of-dogan-set-to-tighten-erdogans-grip-over-turkish-media-idUSKBN1GY0EL. (Accessed Aug. 2018)
Deloitte. 2018. ‘Türkiye’de tahmini medya ve reklam yatırımları, 2017’, March, https://www2.deloitte.com/content/dam/Deloitte/tr/Documents/technology-media-telecommunications/RD%20Medya%20Yatirimlari%20Tablo_MART%202018.pdf. (Accessed Apr. 2018)
Fletcher, R. 2018a. ‘Misinformation and Disinformation Unpacked’, in Reuters Institute Digital News Report 2018. Oxford: Reuters Institute for the Study of Journalism, 38–41.
Fletcher, R. 2018b. ‘The Impact of Greater News Literacy’, in Reuters Institute Digital News Report 2018. Oxford: Reuters Institute for the Study of Journalism, 34–37.
Foça, M. A. 2018. ‘Türkiye’de yayınlanan her iki haberden biri yalan mı?’, P24, 18 June, http://platform24.org/yazarlar/3121/turkiye-de-yayinlanan-her-iki-haberden-biri-yalan-mi. (Accessed Jun. 2018)
The Guardian. 2018. ‘Turkey Fires Thousands of State Employees in Anti-terrorism Purge’, 8 July, https://www.theguardian.com/world/2018/jul/08/turkey-fires-thousands-of-public-servants-in-anti-terror-purge. (Accessed Aug. 2018)
Hürriyet Daily News. 2018. ‘Turkish Daily Habertürk Decides to End Print Edition’, 2 July, http://www.hurriyetdailynews.com/turkish-daily-haberturk-decides-to-end-print-edition-134085. (Accessed Sep. 2018)
Kalogeropoulos, A. 2018. ‘The Rise of Messaging Apps for News’, in Reuters Institute Digital News Report 2018. Oxford: Reuters Institute for the Study of Journalism, 52–54.
Kaplıca, K. 2014. ‘TRT Bütçesi’, Doğruluk Payı, 28 June, https://www.dogrulukpayi.com/iddia-kontrolu/aykut-erdogdu/trt-hic-reklam-alamayan-tamamiyla-enerji-faturalarindaki-o-bizden-kesilen.
Newman, N. 2018a. ‘Executive Summary and Key Findings’, in Reuters Institute Digital News Report 2018. Oxford: Reuters Institute for the Study of Journalism, 8–31.
Newman, N. 2018b. ‘Donations and Crowdfunding: An Emerging Opportunity?’, in Reuters Institute Digital News Report 2018. Oxford: Reuters Institute for the Study of Journalism, 49–51.
The New York Times. 2018. ‘Turkish Media Group Bought by Pro-Government Conglomerate’, 21 March, https://www.nytimes.com/2018/03/21/world/europe/turkey-media-erdogan-dogan.html. (Accessed Apr. 2018)
TÜİK (Turkish Statistical Institute). 2016. ‘Yazılı Medya İstatistikleri, 2015’, 26 July, http://www.tuik.gov.tr/PreHaberBultenleri.do?id=21543. (Accessed Apr. 2018)
TÜİK. 2017. ‘Gazete/dergi sayısı %7,9 azaldı’, 27 July, http://www.tuik.gov.tr/basinOdasi/haberler/2017_40_20172707.pdf. (Accessed Apr. 2018)
Yanatma, S. (2017). Reuters Institute Digital News Report 2017: Turkey Supplementary Report. Oxford: Reuters Institute for the Study of Journalism, https://reutersinstitute.politics.ox.ac.uk/our-research/very-polarised-news-media-and-high-level-distrust-news-turkey
Yeşil, B. 2016. Media in New Turkey: The Origins of an Authoritarian Neoliberal State. Urbana: University of Illinois Press.
About the author
Dr Servet Yanatma was a visiting fellow at the Reuters Institute for the Study of Journalism at the University of Oxford in the academic year of 2017–18. He was also a journalist fellow at the Reuters Institute in the academic year of 2015–16. During that fellowship he wrote a research paper entitled ‘Media Capture and Advertising in Turkey: The Impact of the State on News’. In 2017 he prepared the Reuters Institute Digital News Report 2017 – Turkey Supplementary Report. Servet holds a BA and an MA in history from the Bogazici University in Istanbul. In 2015 he completed his PhD programme at Middle East Technical University with a thesis on ‘The International News Agencies in the Ottoman Empire, 1854–1908’.
Acknowledgements
The author is very grateful to the following people for their contributions and assistance: Dr David Levy, former Director of the Reuters Institute for the Study of Journalism, and Dr Richard Fletcher, Research Fellow at the Reuters Institute for the Study of Journalism.
Any opinions expressed are those of the author.
Published by the Reuters Institute for the Study of Journalism with the support of the Google News Initiative.