The purpose of this RISJ factsheet is to provide top-level usage statistics for the most popular sites that independent fact-checkers and other observers have identified as publishers of false news and online disinformation in two European countries: France and Italy. We focus specifically on sites that independent fact-checkers have shown to publish demonstrably false news and information, whether for profit or for ideological/political purposes. This constitutes a more clearly defined subset of a wider range of issues sometimes discussed using the broad, vague, and politicized term “fake news”. We examine France and Italy as two particularly important cases, as both are widely seen as facing serious issues with for-profit and ideologically/politically motivated online disinformation.
Based on a starting sample of around 300 websites in each country that independent fact-checkers have identified as publishers of false news (which, on this basis, we refer to as “false news sites”), we focus on measuring these sites’ reach, attention, and number of interactions on Facebook. We provide context by comparing these figures with equivalent data for a small selection of the most widely-used French and Italian news brands.
We find that:
- None of the false news websites we considered had an average monthly reach of over 3.5% in 2017, with most reaching less than 1% of the online population in both France and Italy. By comparison, the most popular news websites in France (Le Figaro) and Italy (La Repubblica) had an average monthly reach of 22.3% and 50.9%, respectively;
- The total time spent with false news websites each month is lower than the time spent with news websites. The most popular false news websites in France were viewed for around 10 million minutes per month, and for 7.5 million minutes in Italy. People spent an average of 178 million minutes per month with Le Monde, and 443 million minutes with La Repubblica—more than the combined time spent with all 20 false news sites in each sample;
- Despite clear differences in terms of website access, the level of Facebook interaction (defined as the total number of comments, shares, and reactions) generated by a small number of false news outlets matched or exceeded that produced by the most popular news brands. In France, one false news outlet generated an average of over 11 million interactions per month—five times greater than more established news brands. However, in most cases, in both France and Italy, false news outlets do not generate as many interactions as established news brands.
This factsheet offers only a preliminary measure of the reach of the most popular identified false news websites in Italy and France. Further research is needed to understand the reach and influence of online disinformation in these and other countries.
Approach
We use data from comScore and CrowdTangle to measure the use of both news and false news outlets. comScore is a web analytics company that uses a combination of panel-based and server-side measurement to provide data on the use of the most widely-used websites within particular countries.1 CrowdTangle is a web tool that compiles engagement data for specified Facebook accounts by accessing the Facebook API.2
For both France and Italy, our starting point was lists of unreliable websites compiled by independent fact-checkers and other observers. For France, we used the Décodex—a database of around 1000 websites compiled by Le Monde’s Décodeurs project in the course of their fact-checking.3 In Italy, we combined lists from three different sources.4 Two of these lists were retrieved from independent fact-checking websites—BUTAC and Bufale.5 The third list came from Bufalopedia,6 a website co-created by Paolo Attivissimo, a prominent journalist who describes himself as a “hoax buster”.7 These are the best available, independently-compiled lists of websites that have repeatedly published demonstrably false information, whether for profit or motivated by other reasons.
For comparative purposes, we also included two prominent Russian news sites which have featured in European policy discussions around disinformation, namely Russia Today (RT) and Sputnik. These Russian state-backed organisations are clearly different from sites that engage in for-profit fabrication of false news, but both independent fact-checkers and the EU’s European External Action Service East Stratcom Task Force have identified multiple instances where these sites have published disinformation.8
Not all of the outlets included on the initial lists were relevant for our purposes. Here, we are concerned with outlets that consistently and deliberately publish “false news”, which we have defined elsewhere as “for-profit fabrication, politically-motivated fabrication [and] malicious hoaxes” designed to masquerade as news (Nielsen and Graves 2017). This does not represent the entire wider ecosystem of misinformation and disinformation, which can also be said to include, for example, some forms of satire, advertising, hyperpartisan content, and poor journalism. But it captures key categories of disinformation that are nonetheless important to document the reach of.
In France, the Décodex database divides websites into four categories: (1) satirical websites, (2) websites that have published a significant amount of false information, (3) websites whose approach to verification is questionable, and (4) news websites.9 To filter the list, we excluded all but category 2. In Italy, the lists were also categorized, allowing us to exclude satirical websites. The remaining websites were mostly similar to category 2, as this was the original purpose of the lists. Both Russia Today and Sputnik were listed as category 3 in the Décodex, and, as they are funded by the Russian government, they are different from the other sites. They are therefore displayed separately on the figures below (Russia Today does not have an Italian edition, so only Sputnik was included in Italy).
To align the lists with the data that comScore is able to provide, we excluded a number of other websites. We removed entries that referred to standalone Facebook accounts, Twitter accounts, and YouTube pages, as well as outlets that are part of hosting networks like WordPress, Blogger and AlterVista. Some of these may be prominent and widely-used, but our aim here was to track the use of false news websites specifically (and their associated Facebook pages). Some of the remaining sites were simply too small (in terms of monthly reach) to be tracked by comScore for the whole of 2017, or were not tracked for other reasons, and were therefore removed.
Following this process, we were left with 38 false news websites in France and 21 in Italy, allowing us to estimate average monthly reach and average monthly time spent for many of the most popular online disinformation sources in 2017.10 We present data here for the top 20 false news sites yielded by our search in each country.
Our main focus here is on the direct use of false news websites. But in both countries, and for each outlet, we are able to supplement this on-site usage data with off-site use on Facebook, by using CrowdTangle to estimate the average number of monthly interactions (the total number of comments, shares, and reactions generated by particular Facebook accounts11). Interactions do not measure reach directly (and sometimes people share stories with satirical intent, knowing and making explicit that they know them to be false). But they are a key driver of the so-called “organic reach” of posts, and in the absence of better data, academics use interactions as a meaningful indicator of users’ engagement with sites on social media (Gonzalez-Bailon, Kaltenbrunner, and Banchs 2010). As with comScore, some Facebook accounts are not widely-used enough to be tracked by CrowdTangle, so five French outlets and nine Italian outlets are necessarily excluded from the top 20 in each country. We focus on Facebook because it is the most widely used social media site—far more than, for example, Twitter—and has been one of the main platforms for false news and disinformation in the United States.
Results
France
By examining comScore data from 2017, we can see that all of the false news sites in the French sample have a comparatively small reach (see Figure 1). On average, most reached just 1% or fewer of the French online population each month in 2017. The most popular, Santé+ Magazine—an outlet that has been shown by Les Décodeurs to publish demonstrably false health information—reached 3.1% (this equates to around 1.5 million people). This was more than double that of well-known Russian outlets like Russia Today (1.5%) and Sputnik News (1.4%), which despite their international prominence, are used only by a small minority. All were less widely-used than our selection of the most popular and prominent French news websites, such as Le Figaro (22.3%), Le Monde (19%), and the online news website of the French public service broadcaster, FranceInfo (14.7%).
Reach figures can mask underlying fragmentation patterns. The reach of some false news sites may be small, but this may still be concerning if those that use these sites are simultaneously avoiding news from more credible sources. However, it would appear that the audience overlap between false news sites and news sites is often quite high. For example, if we consider desktop use only (comScore is not able to provide figures for mobile overlap in France or Italy), we see that 45.4% of Santé+ Magazine users also used Le Figaro in October 2017, and 34% used Le Monde. This aligns with previous research showing, despite their size, audiences for niche outlets often overlap with the audiences for more popular mainstream brands (Webster and Ksiazek 2012).
We see a broadly similar pattern when we look at the total average time spent per month with each website (Figure 2). In 2017, French users spent a total of just under 10 million minutes per month with the websites of Santé+ Magazine, with similar figures for Russia Today and Sputnik News. The website of Égalité et Réconciliation—a French political organization founded by former French Communist Party member Alain Soral—also features relatively prominently (5.8 million minutes). These numbers are large in one sense, but much lower than the average time spent per month with news websites. For example, people spent around 170 million minutes with Le Monde online each month during 2017.
One of the reasons that total time spent is a useful measure is that, unlike reach, it is cumulative. In other words, it is possible to add up the total time spent with each false news outlet and compare it to the time spent with news. When we do this, it is interesting to note that although people spent just under 50 million minutes per month with Le HuffPost, even this exceeds the combined time spent with all 20 false news sites in our sample. In France, the gap between false news sites and news sites is larger in terms of time spent than in terms of reach. This is reflected in the fact that, in October 2017, the average time spent per visit was higher for news sites in most cases. This suggests that many of the visits to false news sites are fleeting.
Of course, website use is only one side of the story. Many assume that the on-site web reach of disinformation outlets is dwarfed by their off-site reach on social networks like Facebook. We are unable to measure average monthly Facebook reach in the same way as web reach (only Facebook has access to such data), but we can still examine relative differences by looking at the average number of Facebook interactions (shares, comments, reactions) each outlet received in 2017.
When we do this (see Figure 3), we see that a handful of false news outlets in our sample generated more or as many interactions as established news brands.11 La Gauche m’a Tuer, a right-wing blog, produced an average of around 1.5 million interactions each month, a figure broadly comparable to FranceInfo (1.35 million) and Le HuffPost (1.34 million). Le Top de L’Humour et de l’Info (a site that publishes humour, but also what others have identified as false information) generated just under 6 million monthly interactions, similar to 20 Minutés—the most interacted-with news brand of the five. Santé+ Magazine—the most popular false news outlet in France by this and every other measure—received nearly as many interactions (11.3 million) as the five news sites combined.
These outlets, however, are the exception rather than the rule. Most of the false news outlets in our sample did not generate as many interactions as news brands. Some do not even have a branded Facebook page (though this does not stop their articles being shared by Facebook users). Taken together, the data suggests that in most cases false news outlets do not have a comparatively large reach via Facebook, but also that there are a handful of outlets that outperform or match news brands. This last point should not be dismissed lightly, given the huge gaps between news brands and false news outlets in terms of reputation and resources, as well as the vastly greater amount of online content produced by the news organizations.
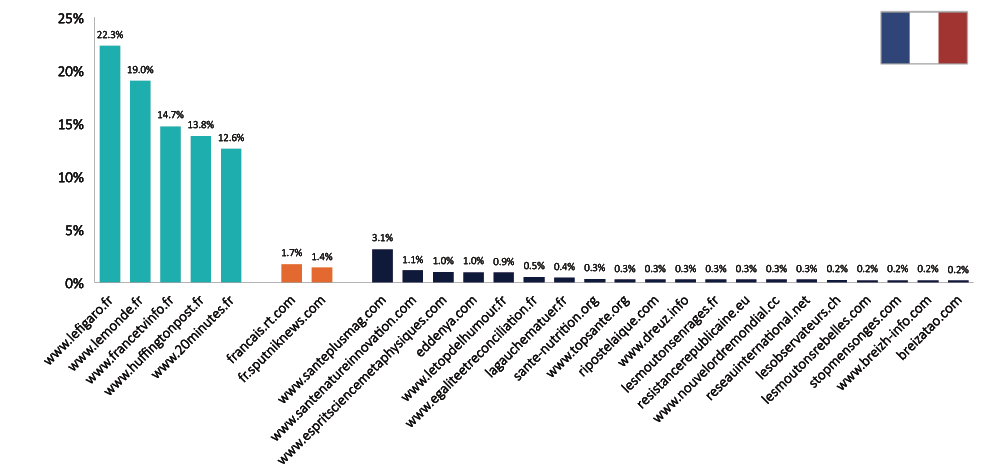
Figure 1. Average monthly reach of prominent French news sites, and some of the most popular false news sites (2017)
Average monthly figures refer to the mean of individual monthly figures for January, April, July and October 2017.
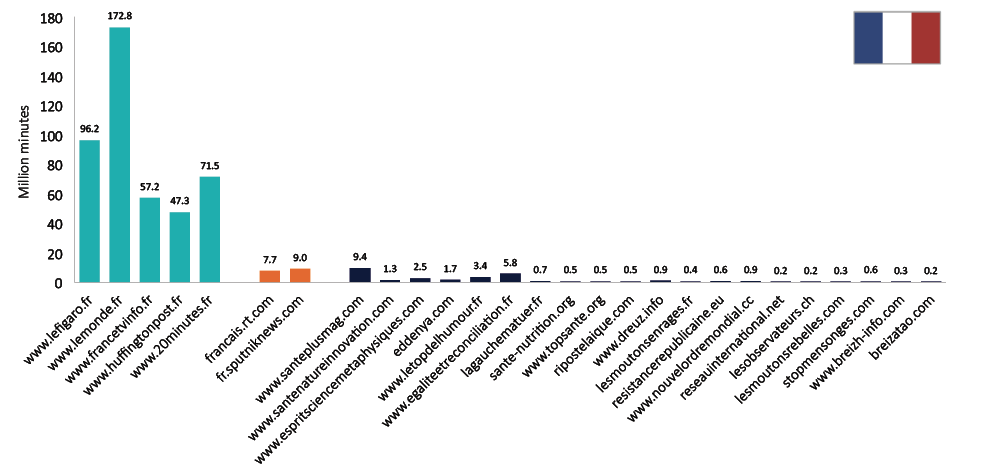
Figure 2. Average monthly time spent with prominent French news sites, and some of the most popular false news sites (2017)
Some news outlets maintain multiple Facebook news accounts. We consider only the single most popular news account that publishes news in the relevant language.
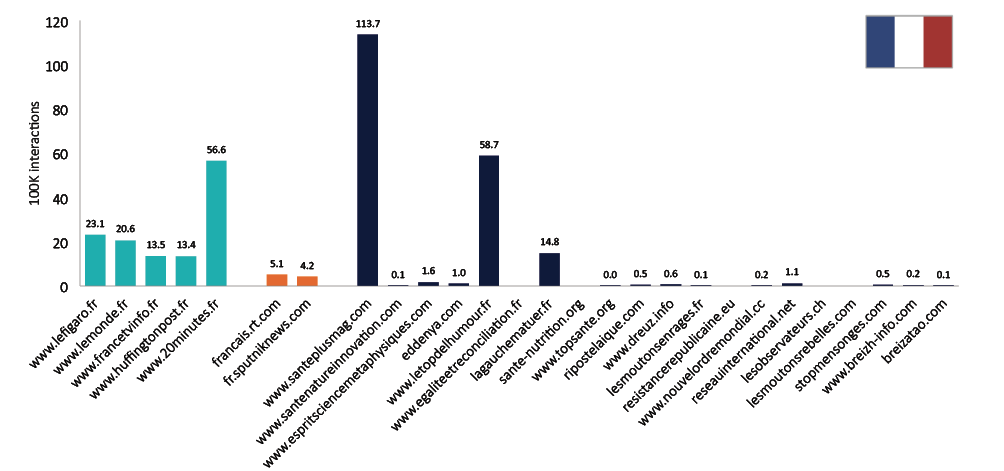
Figure 3. Average monthly Facebook interactions for prominent French news sites, and some of the most popular false news sites (2017)
Italy
In Italy, the most widely-used false news website in our sample—Retenews24—reached 3.1% of the online Italian population (just over 1 million people) on average each month (see Figure 4). As in France, most of the other sites were typically accessed by 1% or fewer. The reach of the Italian edition of Sputnik News was also low, used by an average of 0.6% of the online population each month.
It is important to keep in mind that the most popular online news sites in Italy—including La Repubblica and Il Corriere della Sera—are much more widely used than those in France, reaching approximately 50% of the online population (compared to around 25% in France). This means that relative to the popularity of some news sites, the reach of Italian false news sites is smaller. However, it is also true that some prominent offline outlets—such as Rainews—are not widely-used online.
Like in France, there is also evidence of sizeable audience overlap between false news sites and news sites in Italy. To take one example, in October 2017, 62.2% of Retenews24 users also visited the website of Il Corriere della Sera, and 52.3% used La Repubblica.
If we consider time spent, we see that none of the outlets in the Italian sample exceeded an average of 7.5 million minutes per month on average (see Figure 5). Most had an average total monthly time spent of around 2 million minutes or fewer. The best performing outlet was Meteo Giornale—ostensibly a weather site, but also one that has been shown to publish false information about supposedly imminent asteroid strikes and the like. Again, this is roughly half the equivalent figure for Rainews, but very far behind the figures for La Repubblica (443.5 million minutes) and Il Corriere della Sera (296.6 million minutes).
Again, the difference between the top news brands and false news sites is larger in terms of time spent than in terms of reach. In almost all cases, the average time spent per visit was higher for La Repubblica and Il Corriere della Sera than for false news sites. In this sense, reach figures may overstate the level of actual engagement with the content if visits to false news sites are very brief.
Finally, we can consider the average number of monthly Facebook interactions (see Figure 6). As in France, some false news outlets outperformed news brands in this regard. Eight of the 20 false news outlets in the Italian sample generated more interactions per month than the news website of the Italian public broadcaster, Rainews. The most interacted-with false news outlet was Io Vivo a Roma (720,000 interactions), a site that publishes local news about Rome in addition to what others have identified as disinformation. With the exception of Rai, the news sites we included outperformed the false news outlets. All produced an average of well over one million interactions per month, while La Repubblica generated over 5.5 million. In contrast to France, there was no single outlet in our sample that outperformed all of the news sites we considered.

Figure 4. Average monthly reach of prominent Italian news sites, and some of the most popular false news sites (2017)
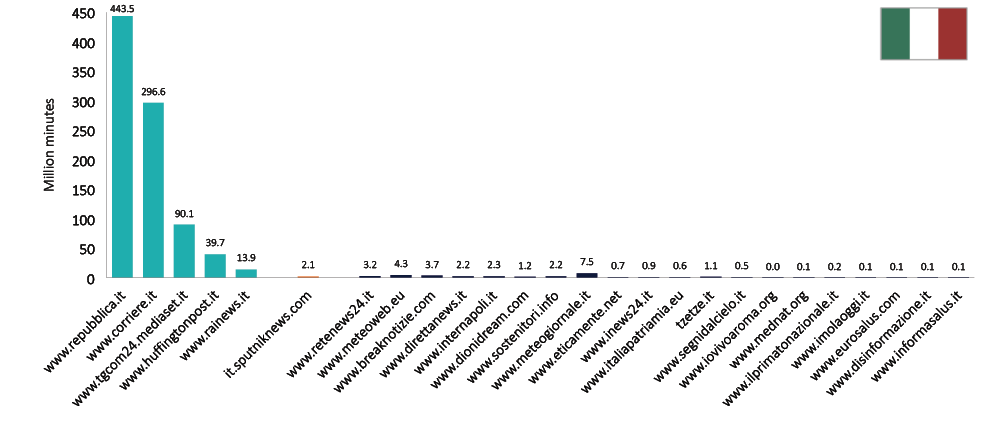
Figure 5. Average monthly time spent with prominent Italian news sites, and some of the most popular false news sites (2017)
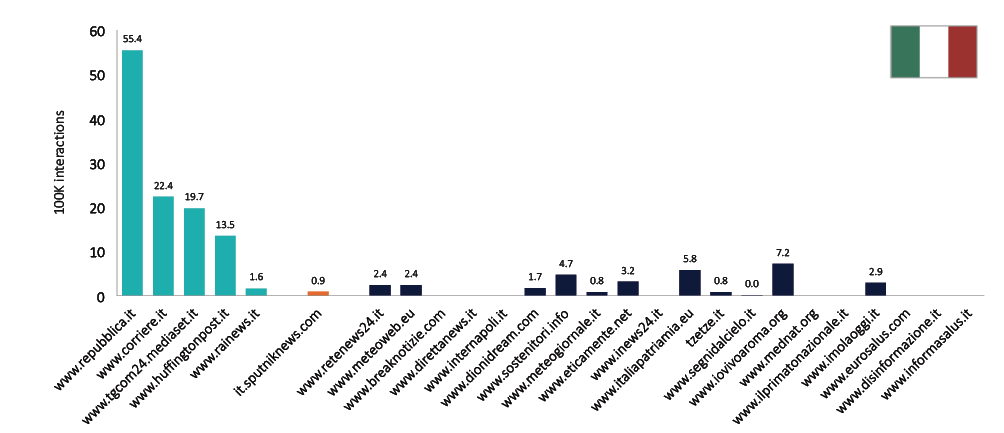
Figure 6. Average monthly Facebook interactions for prominent Italian news sites, and some of the most popular false news sites (2017)
Discussion
Here, we have provided what is to our knowledge the first evidence-based analysis of the reach of “fake news” and online disinformation in Europe, focusing on the two important cases of France and Italy. We have shown that many of the most prominent identified false news websites in these countries are far less popular than major established news sites. However, the difference between false news sites and news sites in terms of interactions on Facebook is less clear-cut. Particularly in France, some false news outlets generated more or as many interactions as news outlets. In Italy, false news outlets were some way behind the most interacted-with news outlets, but some were able to produce more interactions than the Italian public service broadcaster Rai.
We believe that online disinformation is an important issue that the public, publishers, platform companies, policymakers, and other stakeholders should pay serious attention to. But overall, our analysis of the available evidence suggests that false news has more limited reach than is sometimes assumed. This is in line with what independent evidence-based analysis has found in the United States (e.g. Allcott and Gentzkow 2017; Guess, Nyhan, and Reifler 2018; Nelson and Taneja 2018). Whether these findings can be replicated in other European countries is a question for further research. We would expect significant variation depending, in part, on the media and political context of each country, and on the degree to which commercial and/or political motives are likely to encourage the production and promotion of disinformation.
We hope future research will shed additional light on the reach of online disinformation in various countries, and that this factsheet will provide a useful point of reference. Let us therefore highlight some important limitations of this first step in measuring the reach of “fake news” and online disinformation in Europe. The first concerns our primary focus on website use. This is an important dimension, but it is possible that the Facebook reach of the false news outlets listed here may be much higher than that implied by the interaction figures, especially if users share stories independent of the main site, spread them via private messaging apps, or share visual disinformation with no links. Also, due to our reliance on comScore, there may be prominent social-only outlets that we have not tracked (and that independent fact-checkers have not yet identified). (However, our analysis does suggest that we should not simply assume that all false news outlets perform well on Facebook.)
This leads us on to the second limitation, namely our source selection. Our aim was to draw on the best available source lists, but it is possible that these lists do not include some prominent false news websites. We took the decision to exclude sites that trade in other forms of content, such as satire, hyperpartisan opinion material, and poor journalism. And because our focus is on content presented as news, we do not consider wider issues of, for example, extremist content and hate speech. These are important to consider if we want to understand disinformation as a whole. Many of Le Monde’s debunking case studies, for example, show that much false news has its origins in satire. And especially in Italy, some domestic political actors are widely seen as important producers and distributors of disinformation. Our focus on the 20 most popular false news websites also means that we have not considered the potentially ‘long tail’ of false news access. If there are many other sites that publish false news, and the degree of overlap between their audiences is low, it may be that their combined reach is greater than that implied by the low individual reach figures. This matters even more if false news sites are reaching people that news sites do not.
Finally, our use of average figures may mask the reach and impact of individual false news stories and the role of disinformation around specific events or issues. More generally, a glance at the detailed tables in the Appendix shows that there is sometimes a large degree of monthly variation in terms of reach, attention, and Facebook interaction. This is clearly a dynamic and complex issue that calls for additional, more detailed analysis. Our averages suggest that many articles from false news sites do very poorly in terms of online reach and in terms of interaction on social media. But these sites may also still produce the occasional story that, for whatever reason, goes viral on social media and becomes widely viewed. (This does not necessarily mean that the claims made are widely believed.) Similarly, disinformation may well be more widespread around specific events or issues than it is on average and in general. Indeed, regardless of how much we know about exposure, we currently know little about the impact that false news has on people’s attitudes and beliefs, which is often the underlying concern.
This research constitutes what we hope will be a first step on the road to understanding more about the reach of false news and disinformation in Europe. It is clear that much more research into this area is needed, not least because the landscape is constantly evolving. We hope such further research will provide practical and policymaking responses to problems of online disinformation with a more robust base of evidence.
References
Allcott, Hunt, and Matthew Gentzkow. 2017. ‘Social Media and Fake News in the 2016 Election’. Journal of Economic Perspectives 31 (2):211–36.
Gonzalez-Bailon, Sandra, Andreas Kaltenbrunner, and Rafael E. Banchs. 2010. ‘The Structure of Political Discussion Networks: A Model for the Analysis of Online Deliberation’. Journal of Information Technology25 (2):230–43.
Guess, Andy, Brendan Nyhan, and Jason Reifler. 2018. ‘Selective Exposure to Disinformation: Evidence from the Consumption of Fake News During the 2016 US Presidential Campaign’. https://www.dartmouth.edu/~nyhan/fake-news-2016.pdf.
Nelson, Jacob L., and Harsh Taneja. 2018. ‘The Small, Disloyal Fake News Audience: The Role of Audience Availability in Fake News Consumption’. New Media & Society Forthcoming. https://papers.ssrn.com/sol3/papers.cfm?abstract_id=3107731.
Newman, Nic, Richard Fletcher, Antonis Kalogeropoulos, David A. L. Levy, and Rasmus Kleis Nielsen. 2017. ‘Reuters Institute Digital News Report 2017’. Oxford: Reuters Institute for the Study of Journalism.
Nielsen, Rasmus Kleis, and Lucas Graves. 2017. ‘News You Don’t Believe: Audience Perspectives on Fake News’. Oxford: Reuters Institute for the Study of Journalism.
Webster, James G., and Thomas B. Ksiazek. 2012. ‘The Dynamics of Audience Fragmentation: Public Attention in an Age of Digital Media’. Journal of Communication 62 (1):39–56.
Acknowledgements
The authors would like to thank Alexios Mantzarlis, Claire Wardle, and Cameron Hickey for their very helpful comments and suggestions. The research was supported by Google UK as part of the Digital News Initiative (CTR00220), as well as the Digital News Report (CTR00150)
Footnotes:
1 See: www.comscore.com.
2 See: www.crowdtangle.com.
3 See: www.lemonde.fr/verification/
4 We also gathered sources from two recent articles from the New York Times. (www.nytimes.com/2017/11/24/world/europe/italy-election-fake-news.html) and BuzzFeed (www.buzzfeed.com/albertonardelli/one-of-the-biggest-alternative-media-networks-in-italy-is)on disinformation in Italy. However, the outlets mentioned in these articles were already contained in at least one of the three lists.
5 See: www.butac.it and www.bufale.net.
6 See: https://bufalopedia.blogspot.co.uk.
7 See: http://attivissimo.blogspot.co.uk/p/about-me.html.
8 See: www.stopfake.org/ and https://euvsdisinfo.eu/three-things-you-should-know-about-rt-and-sputnik/.
9 See: www.lemonde.fr/les-decodeurs/article/2017/01/23/l-annuaire-des-sources-du-decodex-mode-d-emploi_5067719_4355770.html.
About the authors
Richard Fletcher is a Research Fellow at the Reuters Institute for the Study of Journalism at the University of Oxford.
Alessio Cornia is a Research Fellow at the Reuters Institute for the Study of Journalism at the University of Oxford.
Lucas Graves is a Senior Research Fellow at the Reuters Institute for the Study of Journalism at the University of Oxford.
Rasmus Kleis Nielsen is Director of Research at the Reuters Institute for the Study of Journalism and Professor of Political Communication at the University of Oxford.
Appendix
Table 1. Reach, attention, and Facebook interactions for prominent French news sites, and some of the most popular false news sites (2017)
|
Reach (%) |
Total minutes (MM) |
Facebook interactions (100K) |
|||||||||||||
|
Name |
Jan. |
Apr. |
Jul. |
Oct. |
Avg. |
Jan. |
Apr. |
Jul. |
Oct. |
Avg. |
Jan. |
Apr. |
Jul. |
Oct. |
Avg. |
|
www.lefigaro.fr |
20.1 |
23.7 |
21.5 |
23.9 |
22.3 |
152.8 |
77.0 |
73.2 |
81.9 |
96.2 |
29.7 |
23.2 |
21.8 |
17.7 |
23.1 |
|
www.lemonde.fr |
17.3 |
21.8 |
17.9 |
18.9 |
19.0 |
221.2 |
167.5 |
170.3 |
132.2 |
172.8 |
20.1 |
24.8 |
19.3 |
18.1 |
20.6 |
|
www.francetvinfo.fr |
11.4 |
17.5 |
16.1 |
13.6 |
14.7 |
55.8 |
65.7 |
55.7 |
51.6 |
57.2 |
5.8 |
14.6 |
19.0 |
14.7 |
13.5 |
|
www.huffingtonpost.fr |
16.1 |
14.4 |
11.8 |
12.8 |
13.8 |
62.7 |
44.5 |
39.4 |
42.7 |
47.3 |
16.1 |
17.2 |
10.5 |
9.7 |
13.4 |
|
www.20minutes.fr |
11.5 |
13.5 |
12.3 |
13.0 |
12.6 |
71.2 |
96.8 |
55.1 |
62.7 |
71.5 |
68.2 |
53.7 |
51.8 |
52.8 |
56.6 |
|
www.rt.com |
2.0 |
1.8 |
1.3 |
1.6 |
1.7 |
8.7 |
7.4 |
6.4 |
8.3 |
7.7 |
4.6 |
5.5 |
5.2 |
5.0 |
5.1 |
|
fr.sputniknews.com |
1.6 |
1.6 |
1.0 |
1.3 |
1.4 |
9.9 |
9.6 |
7.0 |
9.3 |
9.0 |
3.0 |
5.9 |
3.7 |
4.3 |
4.2 |
|
www.santeplusmag.com |
5.8 |
2.2 |
2.6 |
1.9 |
3.1 |
18.6 |
6.5 |
7.9 |
4.4 |
9.4 |
120.7 |
132.5 |
110.0 |
91.7 |
113.7 |
|
www.santenatureinnovation.com |
1.4 |
1.2 |
1.0 |
0.9 |
1.1 |
1.7 |
0.7 |
1.9 |
0.8 |
1.3 |
0.1 |
0.1 |
0.2 |
0.1 |
0.1 |
|
www.espritsciencemetaphysiques.com |
0.7 |
1.4 |
1.0 |
0.8 |
1.0 |
1.2 |
3.4 |
2.8 |
2.7 |
2.5 |
1.9 |
1.6 |
1.6 |
1.4 |
1.6 |
|
eddenya.com |
1.0 |
0.5 |
1.3 |
1.0 |
1.0 |
1.8 |
0.8 |
2.2 |
1.8 |
1.7 |
0.7 |
1.1 |
0.6 |
1.5 |
1.0 |
|
www.letopdelhumour.fr |
0.9 |
0.7 |
1.2 |
0.9 |
0.9 |
3.1 |
5.0 |
3.3 |
2.0 |
3.4 |
61.1 |
44.9 |
63.3 |
65.6 |
58.7 |
|
www.egaliteetreconciliation.fr |
0.5 |
0.5 |
0.5 |
0.6 |
0.5 |
6.9 |
7.2 |
2.7 |
6.4 |
5.8 |
– |
– |
– |
– |
– |
|
lagauchematuer.fr |
0.4 |
0.2 |
0.6 |
0.5 |
0.4 |
0.4 |
0.4 |
0.9 |
0.9 |
0.7 |
16.9 |
13.1 |
13.2 |
15.9 |
14.8 |
|
sante-nutrition.org |
0.3 |
0.3 |
0.1 |
0.5 |
0.3 |
0.6 |
0.4 |
0.1 |
0.9 |
0.5 |
– |
– |
– |
– |
– |
|
www.topsante.org |
0.2 |
0.2 |
0.3 |
0.4 |
0.3 |
0.5 |
0.3 |
0.4 |
0.7 |
0.5 |
– |
– |
– |
– |
– |
|
ripostelaique.com |
0.3 |
0.3 |
0.2 |
0.3 |
0.3 |
0.5 |
0.4 |
0.5 |
0.6 |
0.5 |
0.6 |
0.6 |
0.5 |
0.2 |
0.5 |
|
www.dreuz.info |
0.2 |
0.5 |
0.2 |
0.2 |
0.3 |
0.3 |
2.3 |
0.4 |
0.7 |
0.9 |
0.4 |
0.7 |
0.6 |
0.6 |
0.6 |
|
lesmoutonsenrages.fr |
0.2 |
0.3 |
0.2 |
0.3 |
0.3 |
0.2 |
0.4 |
0.5 |
0.6 |
0.4 |
0.1 |
0.1 |
0.1 |
0.1 |
0.1 |
|
resistancerepublicaine.eu |
0.2 |
0.3 |
0.2 |
0.3 |
0.3 |
0.2 |
0.5 |
0.6 |
1.2 |
0.6 |
– |
– |
– |
– |
– |
|
www.nouvelordremondial.cc |
0.2 |
0.2 |
0.4 |
0.2 |
0.3 |
0.3 |
0.8 |
0.6 |
1.7 |
0.9 |
0.2 |
0.1 |
0.1 |
0.2 |
0.2 |
|
reseauinternational.net |
0.3 |
0.2 |
0.3 |
0.2 |
0.3 |
0.2 |
0.2 |
0.2 |
0.1 |
0.2 |
1.1 |
1.3 |
1.2 |
0.9 |
1.1 |
|
lesobservateurs.ch |
0.4 |
0.2 |
0.2 |
0.1 |
0.2 |
0.3 |
0.1 |
0.2 |
0.3 |
0.2 |
– |
– |
– |
– |
– |
|
lesmoutonsrebelles.com |
0.1 |
0.2 |
0.2 |
0.3 |
0.2 |
0.1 |
0.3 |
0.2 |
0.4 |
0.3 |
– |
– |
– |
– |
– |
|
stopmensonges.com |
0.2 |
0.2 |
0.2 |
0.2 |
0.2 |
1.1 |
0.4 |
0.5 |
0.2 |
0.6 |
0.7 |
0.6 |
0.4 |
0.2 |
0.5 |
|
www.breizh-info.com |
0.4 |
0.2 |
0.1 |
0.1 |
0.2 |
0.4 |
0.2 |
0.2 |
0.4 |
0.3 |
0.2 |
0.2 |
0.4 |
0.2 |
0.2 |
|
breizatao.com |
0.2 |
0.1 |
0.1 |
0.3 |
0.2 |
0.2 |
0.1 |
0.1 |
0.3 |
0.2 |
0.2 |
0.1 |
0.1 |
0.1 |
0.1 |
Table 2. Reach, attention, and Facebook interactions for prominent Italian news sites, and some of the most popular false news sites (2017)
|
Reach (%) |
Total minutes (MM) |
Facebook interactions (100K) |
|||||||||||||
|
Name |
Jan. |
Apr. |
Jul. |
Oct. |
Avg. |
Jan. |
Apr. |
Jul. |
Oct. |
Avg. |
Jan. |
Apr. |
Jul. |
Oct. |
Avg. |
|
www.repubblica.it |
49.3 |
48.8 |
48.9 |
56.5 |
50.9 |
472.0 |
421.7 |
412.5 |
467.9 |
443.5 |
67.3 |
45.9 |
52.9 |
55.5 |
55.4 |
|
www.corriere.it |
45.5 |
48.1 |
46.3 |
50.9 |
47.7 |
336.7 |
261.3 |
244.7 |
343.8 |
296.6 |
33.1 |
21.0 |
19.5 |
16.0 |
22.4 |
|
www.tgcom24.mediaset.it |
20.1 |
21.1 |
22.8 |
22.5 |
21.6 |
91.5 |
71.5 |
100.1 |
97.2 |
90.1 |
22.5 |
16.2 |
21.9 |
18.4 |
19.7 |
|
www.huffingtonpost.it |
20.5 |
19.2 |
18.4 |
19.9 |
19.5 |
44.8 |
33.1 |
34.6 |
46.2 |
39.7 |
16.8 |
12.5 |
12.8 |
11.8 |
13.5 |
|
www.rainews.it |
6.8 |
6.4 |
4.7 |
7.0 |
6.2 |
19.4 |
14.1 |
9.4 |
12.8 |
13.9 |
2.2 |
1.4 |
1.6 |
1.3 |
1.6 |
|
it.sputniknews.com |
0.5 |
0.7 |
0.5 |
0.6 |
0.6 |
1.9 |
2.3 |
1.8 |
2.3 |
2.1 |
0.8 |
1.2 |
0.8 |
0.7 |
0.9 |
|
www.retenews24.it |
4.2 |
5.1 |
2.7 |
0.5 |
3.1 |
6.4 |
3.5 |
2.1 |
0.6 |
3.2 |
3.2 |
3.3 |
2.1 |
1.0 |
2.4 |
|
www.meteoweb.eu |
3.4 |
3.2 |
1.9 |
1.5 |
2.5 |
7.5 |
4.9 |
3.0 |
1.7 |
4.3 |
5.4 |
1.2 |
1.7 |
1.2 |
2.4 |
|
www.breaknotizie.com |
1.6 |
1.9 |
1.5 |
1.8 |
1.7 |
3.0 |
3.5 |
4.9 |
3.5 |
3.7 |
– |
– |
– |
– |
– |
|
www.direttanews.it |
1.5 |
1.1 |
1.2 |
1.2 |
1.3 |
3.3 |
2.8 |
1.2 |
1.5 |
2.2 |
– |
– |
– |
– |
– |
|
www.internapoli.it |
1.7 |
0.4 |
0.8 |
0.9 |
1.0 |
6.0 |
1.2 |
0.7 |
1.1 |
2.3 |
– |
– |
– |
– |
– |
|
www.dionidream.com |
1.2 |
1.0 |
0.8 |
0.7 |
0.9 |
2.0 |
1.1 |
0.9 |
0.9 |
1.2 |
2.5 |
1.8 |
1.3 |
1.2 |
1.7 |
|
www.sostenitori.info |
1.8 |
0.7 |
0.6 |
0.6 |
0.9 |
3.9 |
2.7 |
1.4 |
0.8 |
2.2 |
5.2 |
5.9 |
3.6 |
4.1 |
4.7 |
|
www.meteogiornale.it |
0.9 |
0.2 |
1.7 |
0.8 |
0.9 |
19.6 |
1.2 |
5.0 |
4.3 |
7.5 |
1.3 |
0.5 |
1.0 |
0.5 |
0.8 |
|
www.eticamente.net |
1.7 |
0.5 |
0.4 |
0.4 |
0.8 |
1.5 |
0.5 |
0.4 |
0.5 |
0.7 |
3.7 |
2.3 |
3.1 |
3.6 |
3.2 |
|
www.inews24.it |
0.7 |
0.4 |
0.2 |
0.8 |
0.5 |
1.5 |
0.9 |
0.3 |
0.9 |
0.9 |
– |
– |
– |
– |
– |
|
www.italiapatriamia.eu |
0.2 |
0.4 |
1.2 |
0.2 |
0.5 |
0.4 |
0.4 |
1.4 |
0.2 |
0.6 |
4.3 |
4.2 |
7.6 |
7.1 |
5.8 |
|
tzetze.it |
0.3 |
0.5 |
0.7 |
0.2 |
0.4 |
0.8 |
1.6 |
1.8 |
0.3 |
1.1 |
1.3 |
0.6 |
0.8 |
0.5 |
0.8 |
|
www.segnidalcielo.it |
0.1 |
0.1 |
0.3 |
0.5 |
0.3 |
0.5 |
0.1 |
0.4 |
0.9 |
0.5 |
0.0 |
0.1 |
0.0 |
0.0 |
< 0.0 |
|
www.iovivoaroma.org |
0.5 |
0.3 |
0.1 |
0.1 |
0.3 |
0.1 |
< 0.1 |
< 0.1 |
< 0.1 |
< 0.1 |
10.1 |
5.6 |
7.2 |
5.8 |
7.2 |
|
www.mednat.org |
0.4 |
0.2 |
0.1 |
0.2 |
0.2 |
0.3 |
< 0.1 |
< 0.1 |
< 0.1 |
0.1 |
– |
– |
– |
– |
– |
|
www.ilprimatonazionale.it |
0.3 |
0.2 |
0.2 |
0.1 |
0.2 |
0.3 |
0.2 |
0.2 |
0.1 |
0.2 |
– |
– |
– |
– |
– |
|
www.imolaoggi.it |
0.3 |
0.1 |
0.3 |
0.1 |
0.2 |
0.2 |
< 0.1 |
0.2 |
0.1 |
0.1 |
3.6 |
1.9 |
3.2 |
2.9 |
2.9 |
|
www.eurosalus.com |
0.1 |
0.1 |
0.3 |
0.1 |
0.2 |
0.1 |
0.1 |
0.2 |
0.1 |
0.1 |
– |
– |
– |
– |
– |
|
www.disinformazione.it |
0.1 |
0.1 |
0.1 |
0.1 |
0.1 |
0.1 |
0.1 |
0.1 |
< 0.1 |
0.1 |
– |
– |
– |
– |
– |
|
www.informasalus.it |
0.1 |
0.1 |
0.1 |
0.1 |
0.1 |
0.1 |
0.1 |
0.1 |
0.1 |
0.1 |
– |
– |
– |
– |
– |