


Executive Summary and Key Findings
This report presents the most detailed and comprehensive analysis to date of news use during the 2019 UK General Election. It is based on a unique tracking study of the online news consumption of 1,711 people aged 18-65 across mobile and desktop devices throughout the campaign (spanning six weeks), combined with surveys with a subset of 752 panellists fielded before and after the vote, asking them about the relative importance of offline and online news and their attitudes to the media and politics more widely.
We show that online news sources (including news websites/apps and social media) are more widely used than any other source among those with internet access. Online news use during the election had wide reach, but limited engagement.
- Almost three-quarters (72%) visited a news site to read a news story during the campaign. BBC News was by far the most widely used online source for election news. It was accessed by more than four in ten of our sample (44%) during the course of the election and was the main destination for election results.
- Only 3% of all internet time was spent with news. On average, people spent 16 minutes per week with news and made around 22 news visits each week across web and mobile during the campaign. While election news made up around half (51%) of the most viewed stories in the first week, the proportion declined to just 24% later in the campaign. (Interest picked up again when the results were announced, with the election accounting for around 61% of top stories during that week.)
- Young people (18-34) were even less engaged with online news websites, spending less than half as much time (8 minutes a week) with news as older groups (22 minutes) and visiting fewer websites.
- Much of the time spent with news was spent with sites with no clear political alignment (those required to be impartial and national newspapers which made no endorsement), and most news users accessed a variety of sources, including both sources aligned with their own political views and sources that challenge them. We find evidence for partisan selective exposure, but also a lot of cross-cutting exposure (especially among those who rely on social media) and little evidence of partisan selective avoidance. Almost no one exclusively consumed news from outlets supporting the party they voted for. Just 4% of Conservative voters and 2% of Labour voters only used online news sources supporting their preferred party.
In more detail:
- We show that online news during the campaign was a winner-takes-most market, with just two providers, the BBC News and the MailOnline, accounting for nearly half (48%) the time spent with news, and the top five (including the Guardian, the Sun, and the Mirror) accounting for two-thirds (66%) of the time spent.
- Much of this news consumption came from websites committed to impartial coverage and those that made no party endorsement (33%). Just under one third (31%) came from outlets that endorsed the Conservative Party and one in eight (12%) from outlets that endorsed the Labour Party. Alternative brands such as the Canary, Novara Media on the left and Breitbart on the right – along with foreign sites like Russia Today and Sputnik – played a relatively small part with just 1% share of the time spent with news, about 0.02% of the time people spent online during the election.
- In mobile apps, people spent even less time with news than on the open web. Far more people used news websites via mobile or desktop browsers and the vast majority are not sufficiently interested in news to download a specific news app. All news apps account for less than 1% of total time spent with apps. (To put this in perspective, Facebook, YouTube, and Twitter together accounted for 30 times as much time.) The BBC News app was by far the most used news app in the UK with around one in ten (10%) app users loading it during the course of the campaign. The BBC app was used by three times as many people as the next most popular app, Sky News.
- People who use social media for news accessed more online news sources during the campaign than those who do not, despite reading a similar number of news stories. Similarly, those who say they use search engines to search for news topics were also found to access a higher number of different outlets on average than those who do not. Voters who used social media for news also had higher levels of cross-cutting news exposure on average. In other words, people who use social for news consumed more news from the opposing camp rather than less.
- Despite hundreds of thousands of pounds spent on social media advertising by political parties, only around one in seven (14%) of our survey respondents said they had seen one of these political ads online. This compared with almost two-thirds (63%) who had seen a political leaflet and one in ten who had received a visit from a political representative at home (9%).
- Our survey data are a reminder that television continues to play an important role, both in reaching diverse audiences and helping to define choices. TV was particularly important for older groups while younger people consumed most of their election news online and via social media.
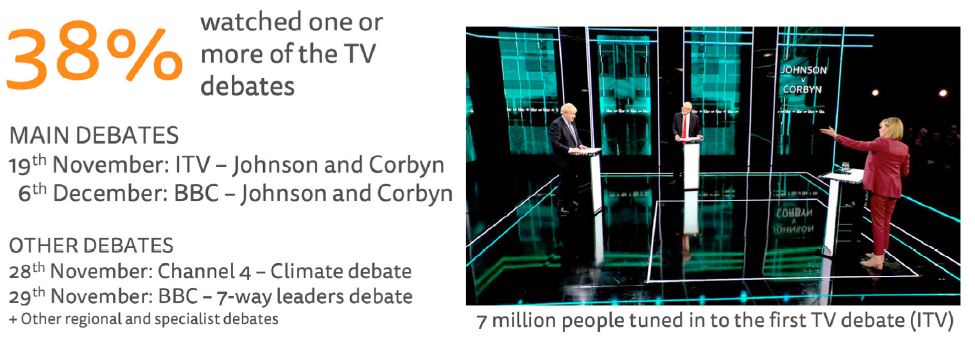
- Around a third (35%) of those who watched the TV debates said these had helped inform their voting choice. But only around 20% of our sample watched any of these directly on TV. The rest caught up via news bulletins, online websites, or social media.
- Despite heavy criticism of the BBC on social media and from rival news organisations, far more of our respondents felt the BBC had done a good job with its election coverage (43%) than a bad job (14%). This was also true of the other broadcast brands ITV News, C4, and Sky News. This is a reminder that the concerns of the highly politically engaged – often expressed on networks like Twitter – can sometimes give a misleading impression of wider public opinion.
- Attitudes towards the news media diverged considerably during the campaign, with Labour voters in particular expressing lower trust and less favourable evaluations of the media’s ability to explain policies, fact-check politicians, and make the election interesting. At the start of the campaign trust among Conservative and Labour voters was the same, but by the end of the campaign there was an 11 percentage point gap.
- The majority of our respondents said they were concerned about being able to distinguish real and false information on the internet during the election. This concern increased during the campaign for Labour voters. In a campaign which saw political parties regularly criticised by independent fact-checkers, politicians were seen as most responsible (35%) for spreading false or misleading information, followed by journalists (14%) and ordinary people (12%). Concern about foreign governments was lower at 7%.
The people we tracked to collect data for this report spent hours and hours on their smartphones and personal computers, engaging with countless websites and many different platforms for a wide variety of purposes. In the course of the six-week campaign, the vast majority visited a mainstream news site at least once to read a news story (and more than half followed television news on a weekly basis), reminding us that, even as digital advertising, social media, and the like give politicians new ways to circumvent journalists, the news media still play an important role in scrutinising politicians and helping to inform voters.
How well people feel the news media play this role varies. When it comes to the coverage of the election, between 30% and 40% of our respondents say they thought that the media as a whole did a good job, but nearly a third say that no news source was particularly helpful in terms of helping them understand the issues of the election or make a voting decision.
Overall, much elite and public debate around the role of the media in politics before, during, and after the election has focused on the risks of political polarisation (especially around the issue of Brexit, and with two divisive party leaders). Our analysis here suggests that the bigger issue may be that many people do not engage much with news at all, spending just 3% of their time online with news.
Introduction
The recent 2019 UK General Election was a divisive and bad-tempered affair held against the background of Brexit stalemate and rows over the impact of austerity on public services. In the end Boris Johnson’s Conservative Party gained a majority of 80 seats as voters backed his promise to ‘get Brexit done’ and take the country out of the European Union by 31 January 2020 and voters also seemed to have reservations about Jeremy Corbyn, the opposition Labour Party leader.
The election was called at the end of October 2019 after parliament agreed that a fresh mandate was required to break the Brexit impasse. Campaigning officially began on 6 November and spanned six weeks. Polling day was Thursday 12 December.
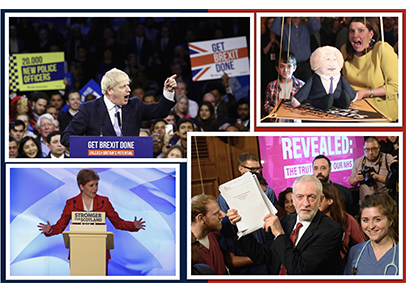
Clockwise from top left: • Britain’s Prime Minister Boris Johnson speaks during a final general election campaign event in London, Britain, December 11, 2019. REUTERS/Hannah McKay; • Britain’s Liberal Democrats leader Jo Swinson reacts next to a puppet depicting British Prime Minister Boris Johnson at an event in Edinburgh, Scotland, Britain, December 5, 2019. REUTERS/Russell Cheyne; • Britain’s opposition Labour Party leader Jeremy Corbyn with NHS staff, after a press briefing during a general election campaign event in London, Britain, November 27, 2019. REUTERS/Toby Melville; • Scotland’s First Minister Nicola Sturgeon makes a keynote election speech in Dundee, Scotland, November 20, 2019. REUTERS/Russell Cheyne
Voters rated Brexit as the most important issue facing the country both before and after the campaign. The state of the National Health Service was the second most important issue, growing in importance as the campaign progressed, according to our survey, partly because the election coincided with a period of acute winter bed-shortages.
Manifesto launches, TV debates, and set-piece interviews were key features of the campaign as politicians set out their policies through the lens of the media. But direct political communication was also important, with door-to-door campaigning, leaflet drops, and hundreds of thousands of pounds spent by parties on social media advertisements.
But what role did the media play in this result? Did TV and the press define and shape people’s choices? Or were online sources more important? How did social media affect the tone and substance of the debate?
That is the focus of this report which is based on tracking the online news consumption of 1,711 people across mobile and desktop devices throughout the six-week campaign. We combined these data with surveys where we asked 752 of the same people about the relative importance of offline and online media and attitudes to the news and politics more widely.
1. News Consumption across Online and Offline Media
Some commentators have questioned the importance of traditional news formats such as TV and print in comparison with online and especially social media. In this first chapter, we explore the relative importance of these different media but also the way they were used in combination by different groups over the course of the campaign. We base this section largely on the survey data which allows us to compare usage of different sources of news and combine this with demographic and political information. We should bear in mind that as this is an online poll (covering ages 18–65 only) it is likely to underestimate the role of traditional media such as TV, print, and radio for those who are not online.
Later we’ll turn to the tracking data to understand online behaviour in detail, but first we need to understand more about how online fits into wider news diets.
Media Consumption Compared
We look first at the proportion of people who used TV, print, radio, online news, or social media for news overall in the last week of the campaign and compare this with consumption of election news (Fig. 1). TV and online news (including social media) were the most important sources of news overall, with 57% of our respondents using TV and 70% accessing online news. Within online, news websites reached more than half of our respondents (56%) but social media was also significant with four in ten (41%) having used it to get the news in the previous week. Only around a third used radio to get news and roughly a quarter of our online sample read printed newspapers. This consumption pattern matches findings that we have published in our previous Digital News Report based on data from the beginning of 2019.
As one might expect, consumption is slightly lower across the board when we ask just about election news. While reliance on online news drops by 14pp, television largely holds its share indicating that the medium may have played a bigger role around the election, at least for some. TV news spends a great deal of time covering election issues and that can reduce the space available for other news. By contrast, there tends to be a greater variety of news stories available online and in social media, which means more distractions – and more opportunities to avoid election news in particular.
Figure 1. Proportion that used different sources of news/election news in the last week of the campaign NEWSSOURCE_POST. Which, if any, of the following have you used in the last week as a source of news? NEWSSOURCEELECTION. Which of these have you used to get news about the 2019 UK General Election in the last week? Base: Total survey sample = 752.
When it comes to election news specifically, we also see differences around age and political allegiance – which we know are linked in the UK (Fig. 2). Younger users were much more likely to use online news and social media while older ones were more likely to rely on offline media – particularly TV, but also radio and print. There is a similar split when it comes to political allegiance, with Labour voters more likely to use online news and social media when compared with their respective counterparts. This is likely to be strongly linked to age because Labour voters tend to be younger on average.
Figure 2. Proportion that used different sources for election news in the last week of the campaign
 NEWSSOURCEELECTION. Which of these have you used to get news about the 2019 UK General Election in the last week? P2019VOTEACTUAL. Which party did you vote for? Base: All survey respondents: 18-34 = 150, 35-65 = 602. All survey respondents that voted: Conservative = 213, Labour = 217.
These age-related differences between online and traditional media are striking but so too is the role played by social media within the online category. Four in ten (36%) of 18–34s say they used social media to access election news, only slightly fewer than the percentage that accessed online news sites (49%). One in seven (13%) of the younger group say they only consumed news from social media in the last week of the campaign. 21% of 35–65s say they only consumed TV news.
We’ll come back to perceptions of the importance of different sources of election news later in this report.
2. Online News Consumption in Detail
In this chapter we dig much more deeply into the detail of online news consumption using our tracking data with 1,711 participants aged 18–65, including all of those who took the survey. With the agreement of panellists, we monitored all the news websites and apps they visited on computers and mobile phones as well as their wider web usage. This methodology should provide more accurate data about what these respondents did rather than just what they remember when asked in a survey.
Taking the whole six weeks from 4 November to 15 December, we find that around three-quarters (72%) of the entire online panel visited one or more news websites during the election campaign, with the top 30 sites accounting for the vast majority of that. The average news user spent 16 minutes a week reading online news stories during the six-week campaign and accessed around 22 news stories each week across web and mobile. This is a significant amount of news consumption, but to put it in perspective, it is worth pointing out news makes up just 3% of all internet time – even during an election period.
Tracking data. Base: All that accessed a website between Nov 4 and Dec 15 2019 = 1,666.
Figure 3. Reach of different types of news sites during the campaign Tracking data. Base: All that accessed a website between 4 Nov and 15 Dec 2019 = 1,666.Note. Numbers in parentheses show the number of sites monitored in each category.
National and international news sites reached almost three-quarters (71%) of all website users, with hundreds of local sites together reaching four in ten (40%) – but with very low figures for each individual website (Fig. 3). Partisan digital sites such as the Canary and Novara Media and foreign sites like Russia Today (RT) collectively reached 6% of users. RT’s reach was roughly equivalent to that of the Brighton Argus, a popular local title, at around 1% of our sample. We also monitored traffic to over one hundred pro- and anti-Brexit pages on Facebook, but these were visited by less than 2% in total. Satire sites were used by around 3% of our sample.
Daily online usage fluctuated during the course of the campaign with significant peaks at the start of the campaign (6 November) and again at the end for the results (12 and 13 December) (Fig. 4). It is striking that overall online news consumption during the election was no higher than the month before – a period which saw a deal with the EU and a series of political manoeuvrings and high-profile parliamentary votes. On 29 October Boris Johnson finally got his wish for a pre-Christmas vote and the campaign started the following week.
Peaks of interest during the campaign itself were mainly focused around non-election stories such as flooding in the North of England, a terror attack in London, and a BBC interview with Prince Andrew where he tried to ‘clear the air’ over his friendship with Jeffery Epstein. Some of these became political issues which demanded a response and diverted the parties from their core messages for several days.
Figure 4. Average time spent with news sites per day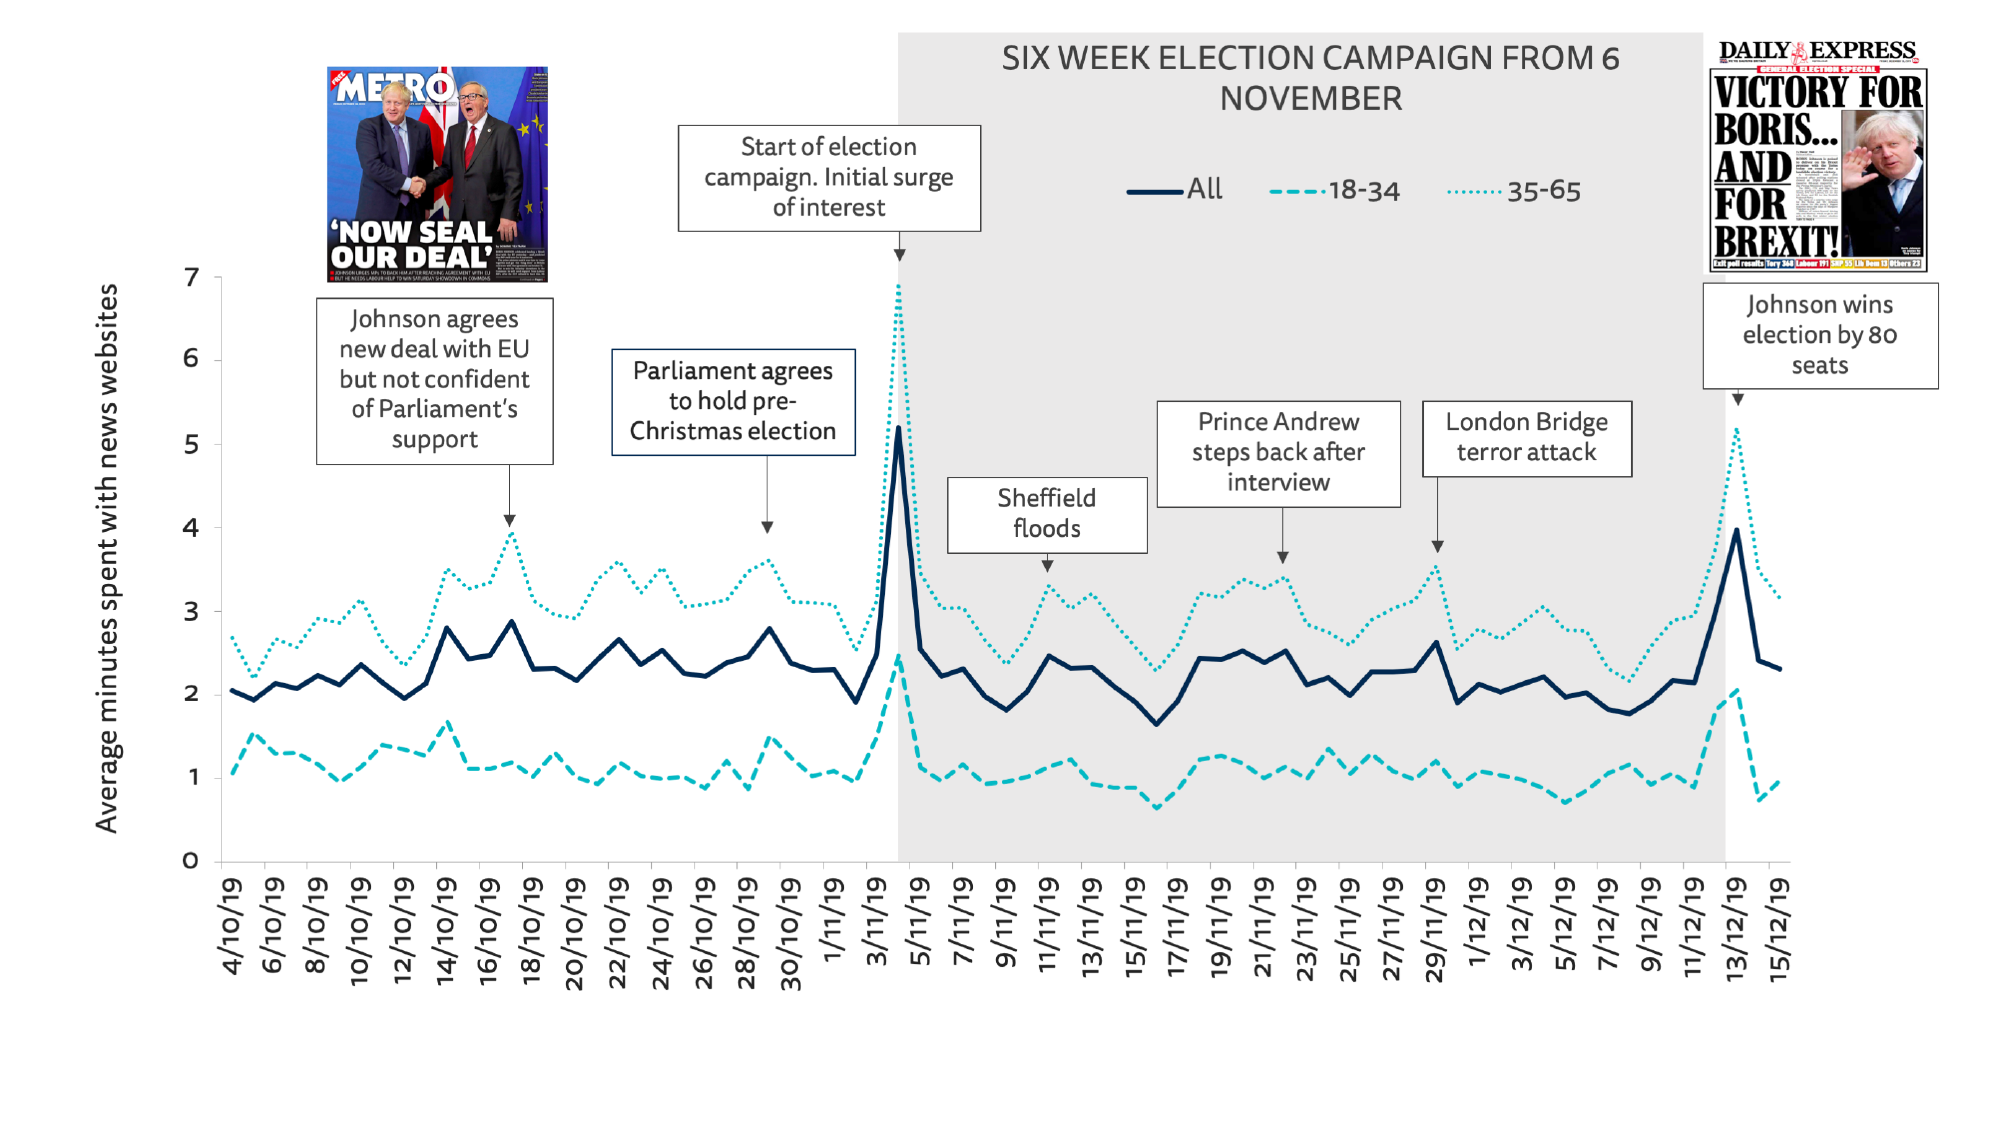 Tracking data. Base: All that accessed a website between 4 Oct and 15 Dec 2019 = 1,806.
Figure 5. Other stories knocked the election off top spot Floods in Sheffield in the first week, Prince Andrew’s interview with the BBC in the second, and the London Bridge terror attack in the fourth all diverted attention from the election and demanded political responses. Far left: REUTERS/Jon Super; Centre: Mark Harrison/BBC; Right: REUTERS/Henry Nicholls
Which News Websites were Most Heavily Used during the Election Period?
The BBC was the most heavily used news website in terms of people reached (44%), the number of stories read, and the time people spent with those stories (Fig. 6). Right-leaning Conservative supporting titles, the MailOnline, the Sun, Telegraph, and Express, also attracted considerable online reach, as did the Guardian and the Mirror, which tended to be more sympathetic towards Labour.
Figure 6. Reach of specific news websites during campaign Tracking data. Base: All that accessed a website between 4 Nov and 15 Dec 2019 = 1,666.
It should be noted that, for the BBC and Sky News, we only measured traffic to their news domain. For other websites, such as the MailOnline and the Guardian, we tracked all content including sport and a wider range of lifestyle content. It is likely that, when it comes to political and election coverage, there is an even bigger gap than is indicated here between the BBC and the rest.
Our approach, which is based on measuring access to hundreds of thousands of story URLs under a publisher domain, does not allow us to identify political news or election coverage specifically.
We should also be wary of just looking at website reach. We get a very different picture if we look at the time people spend with different websites. This is arguably a better measure of engagement and shows the importance of a small handful of sites in the UK. Taken together, the BBC (28%) and the MailOnline (21%) account for almost half of all time with news sites while the Guardian (7%), the Mirror (6%), and the Sun (5%) make a significant contribution (Fig. 7). Other sites that do well in terms of reach, however, such as the Express and the Independent, show very low levels of time spent, with around 2% of the overall news pie. In many cases, this is because traffic to these sites tends to be irregular use from social media or search rather than regular and loyal audiences.
Figure 7. Time spent with news sites during the campaign
 Tracking data. Base: All that accessed a website between 4 Nov and 15 Dec 2019 = 1,666.
Using the time-spent metric, we can also identify the amount of time people spent online with brands that supported the Conservatives (right-leaning) or Labour (left-leaning).
In the UK, most national newspapers openly endorse either Labour or the Conservatives during election campaigns, and actively encourage their readers to vote for them. In 2019, the Mirror and the Guardian endorsed Labour, whereas the Daily Mail, the Daily Express, The Times, the Daily Telegraph, and the Sun backed the Conservatives (the i, the Independent, and the FT did not make an endorsement in 2019). However, strict laws mean that broadcasters like Sky, Channel 4, ITV, and the BBC must remain politically neutral, and devote equal airtime to parties and candidates.
Figure 8. Proportion of news site time spent with different types of outlet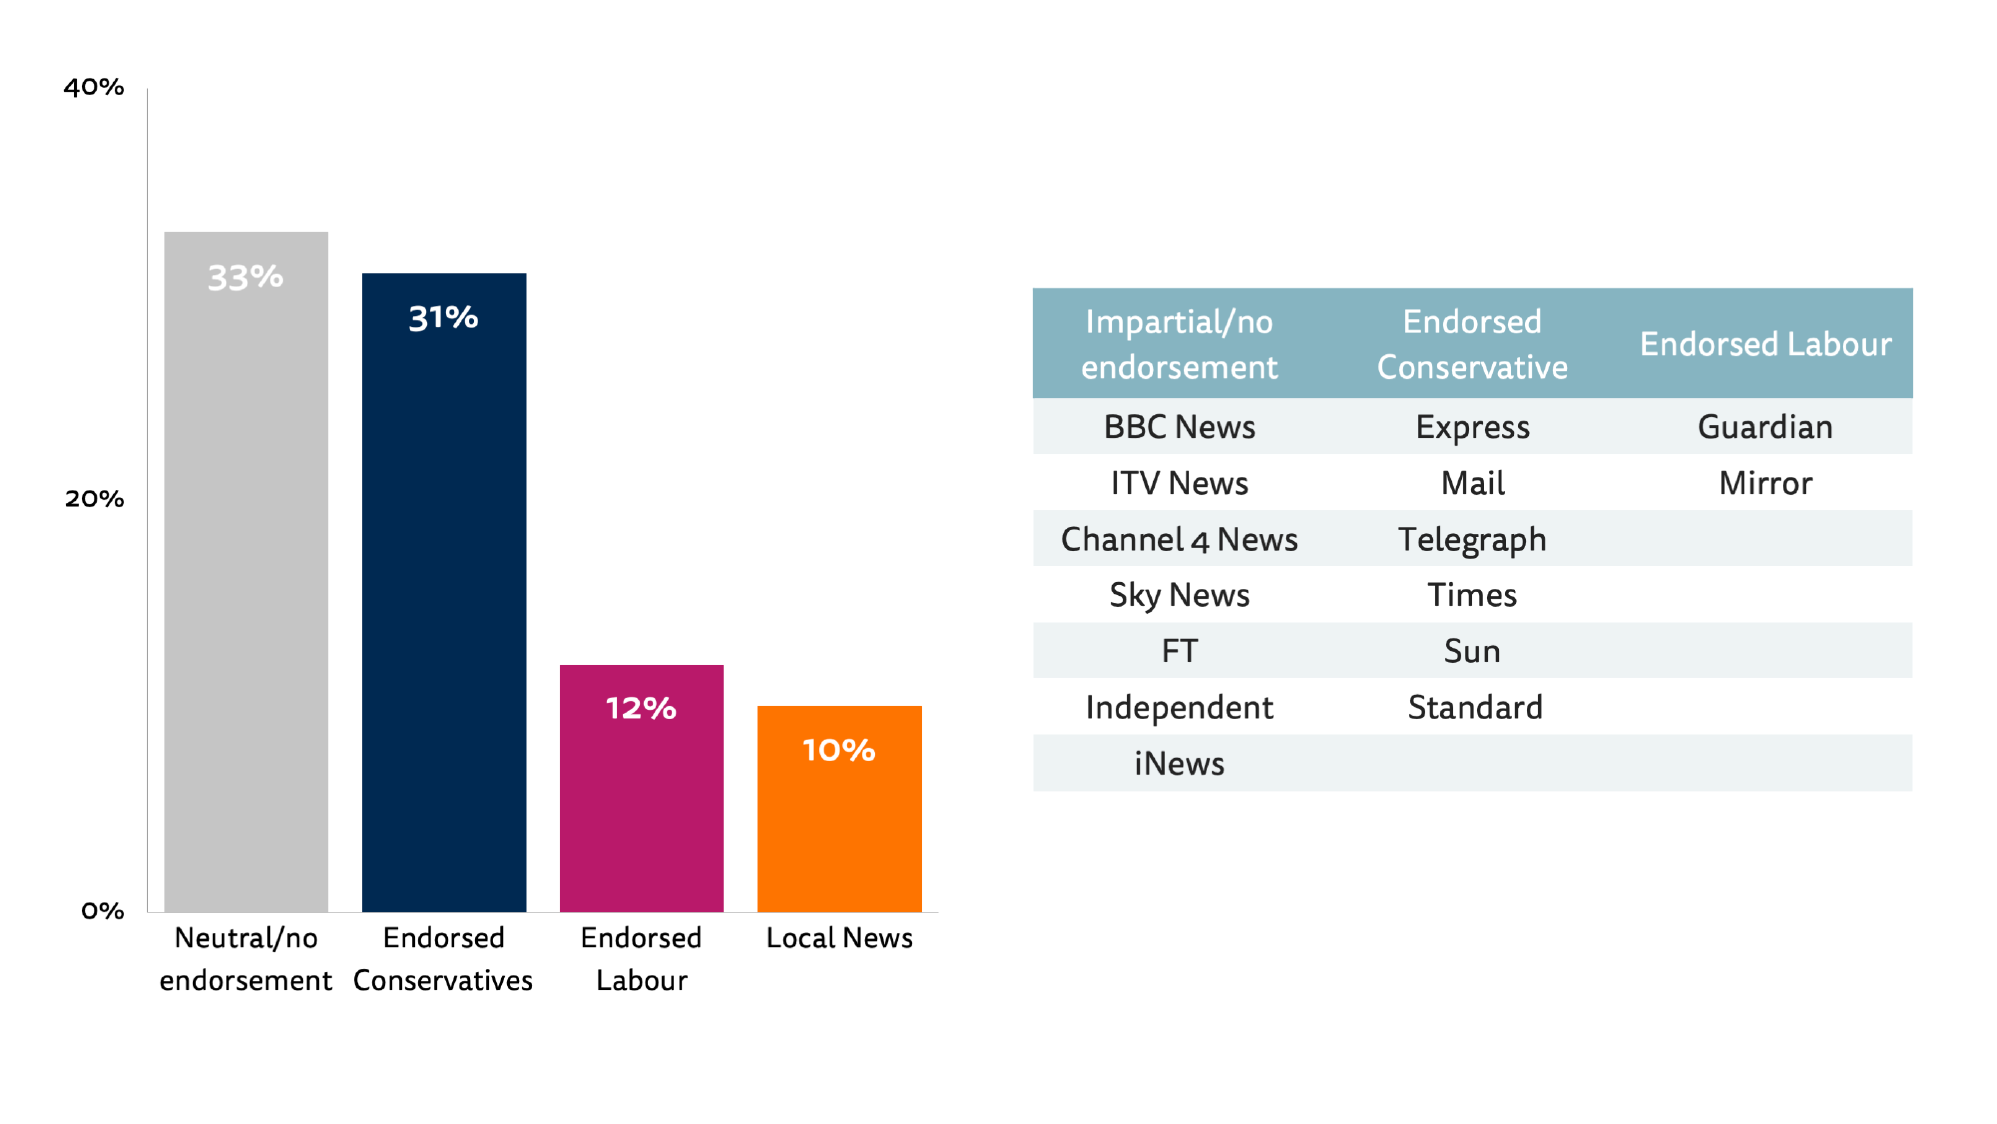
Tracking data. Base: All that accessed a website between 4 Nov and 15 Dec 2019 = 1,666. Note. The sites listed in the table here account for more than 75% of all time with news sites. Most local sites made no endorsement though a number, like the Liverpool Echo, did make a recommendation to readers.
Here we see that much of the time spent with online news media during the election was with brands that had obligations to be impartial (broadcast brands like BBC and ITV) or those that took a non-partisan view (like many local newspapers) (Fig. 8). Brands that openly supported the Conservatives (e.g. Mail, Telegraph, Times, Sun) accounted for nearly three times as much time as those that supported Labour (e.g. Guardian, Mirror).1
In combination with our survey evidence about the importance of television as a source of election news, it is clear that sources with obligations around balance and due impartiality remain critical for framing political news offline and online in the UK. This is a very different picture from the one we see in the United States where some commercial broadcast media (and their websites) take a partisan approach to much of their coverage and public media are less influential.
Having said that, obligations around impartiality are not the same as being seen to be fair and balanced. There was significant criticism during and after the campaign on social media and from participants and candidates about hidden and overt biases.2 Senior BBC and ITV correspondents were regularly accused of bias from both Conservative and Labour supporters. We explore these issues further in Chapter 4 where we look in more detail at the issue of trust.
Where did Younger and Older Groups Get their Online News during the Election?
We’ve already seen in Chapter 1 that young people were more likely to get their news online than older groups so it is something of a surprise to find in our tracking data that the young were accessing fewer online mainstream news sites overall. Two-thirds (66%) of 18–35s accessed any news site during the six-week campaign compared with three-quarters (76%) for 35–65s (Fig. 9). This suggests that young people are turning to other sources of online news.
Young people used mainstream brands (BBC, MailOnline, the Guardian, Sun, and Mirror) during the campaign, but they used them proportionally less. The main exception was the Guardian which had a slightly higher proportion of under-35s than over-35s and the same was true of digital-born brand BuzzFeed, though with much lower reach overall.
Figure 9. Reach of selected news sites by age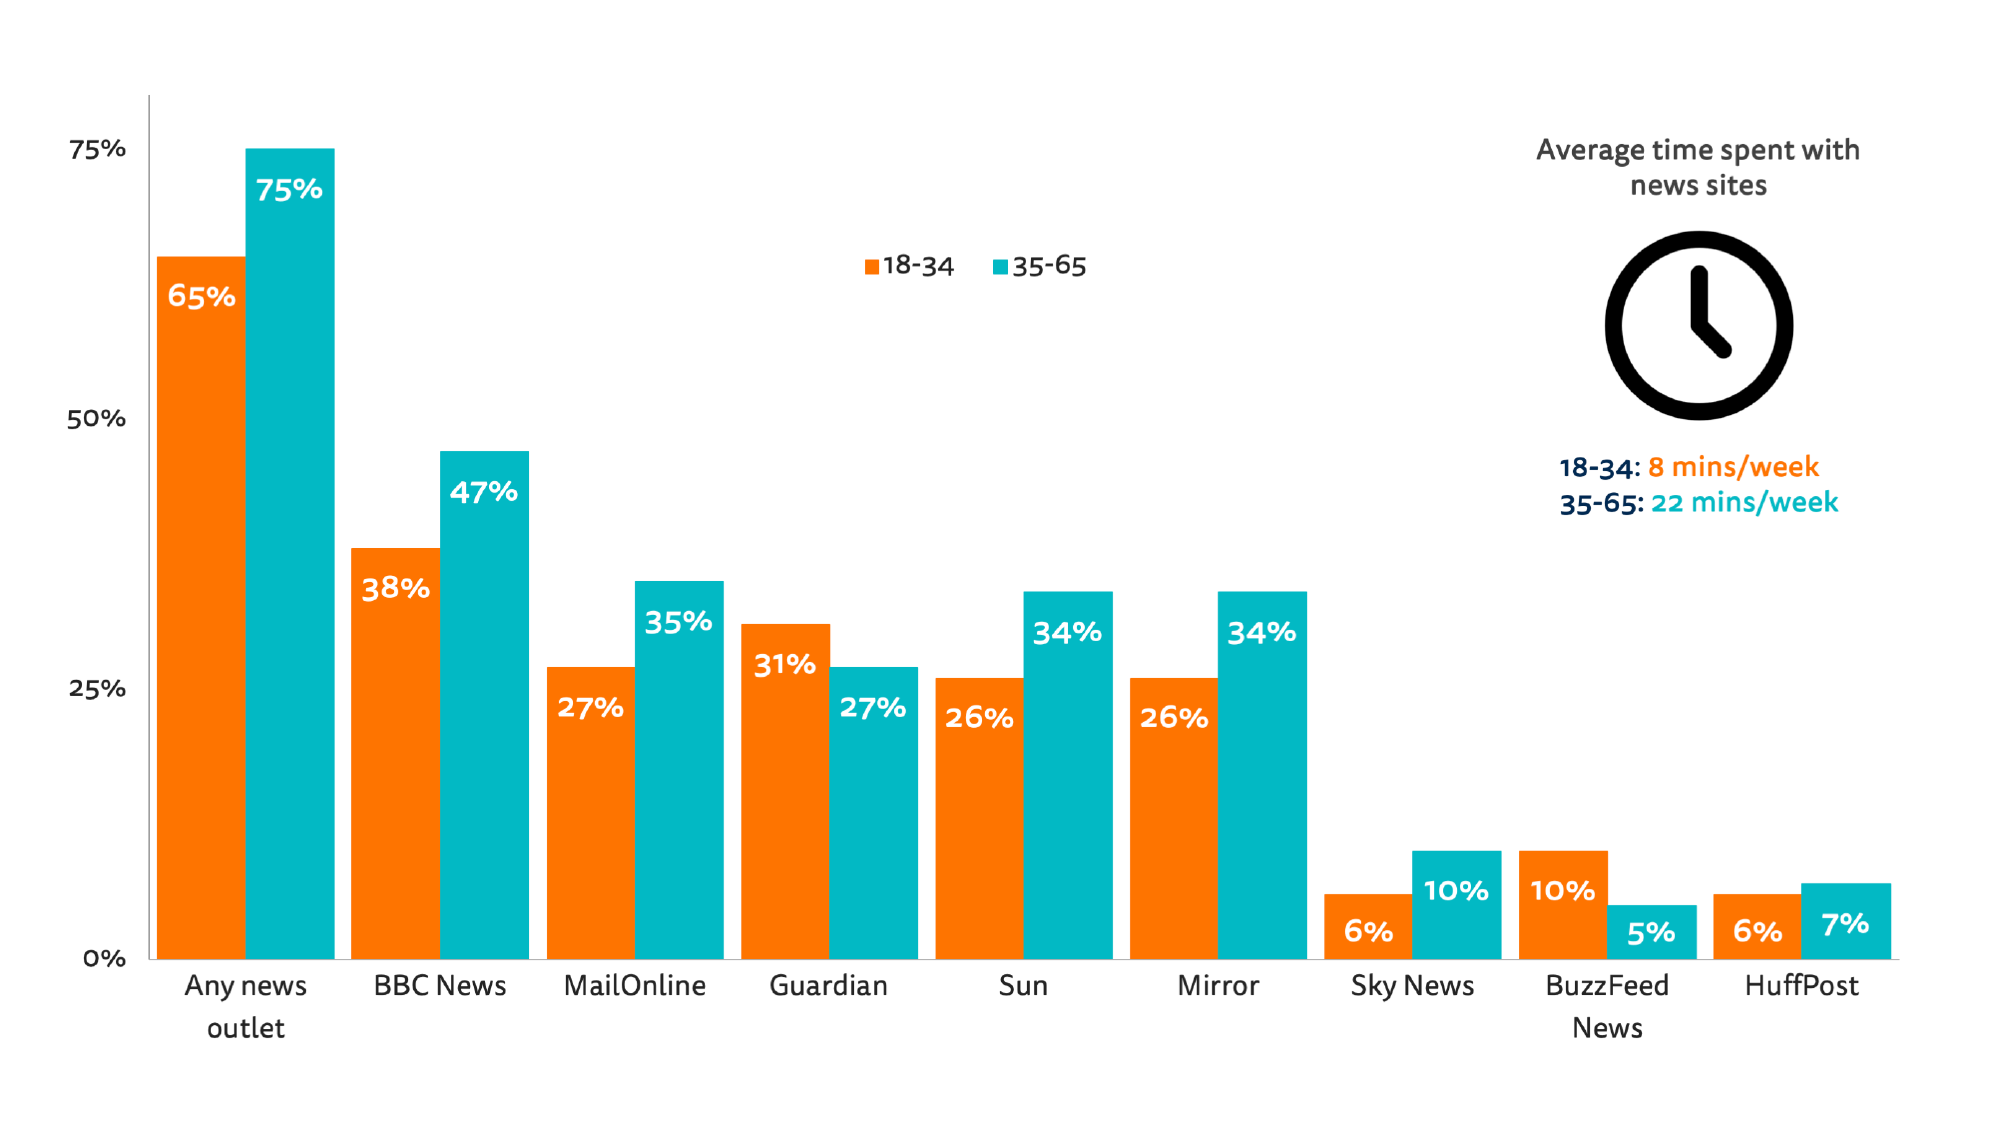 Tracking data. Base: 18-34s/35s-65s that accessed a website between 4 Nov and 15 Dec 2019 = 673/1051.
Even more striking was the difference in engagement amongst under-35s, who spent less than half as much time reading news stories (8 minutes/week) when compared with over-35s (22 minutes/week) (Fig. 9). We know that young people are less interested in politics and less likely to vote, but given they also consume less TV and radio news this is worrying from a democratic perspective.
It is possible that social media is making up some of this gap, but other research suggests that this tends to involve catching up on headlines, watching short videos, and sharing memes rather than engaging with deep or nuanced coverage.3 In our survey, under-35s say they used news websites for election news more often than social media and far more than TV or print. They also said that news websites were the most important in helping them understand the issues in the election. And yet 8 minutes a week (less than 2 minutes a day), on average, spent reading all news websites suggests that this group has been paying little attention to their own medium of choice.
The Role of News Apps
Our tracking methodology also allows us to look at the time spent with different news apps during the election and to compare this with other apps that people use. Here we find that, among app users, BBC News (10%) and Sky News (3%) had by far the highest reach of any news app during the campaign but there was very little traction for others (Fig. 10). Overall, 18% accessed one or more news apps during the campaign compared to 66% that used Facebook, 64% WhatsApp, and 27% Twitter. People who used apps spent more time on average than those who used the mobile or desktop websites but in total time with news apps was less than 1% of all app usage.
Figure 10. Reach and time spent with apps during the campaign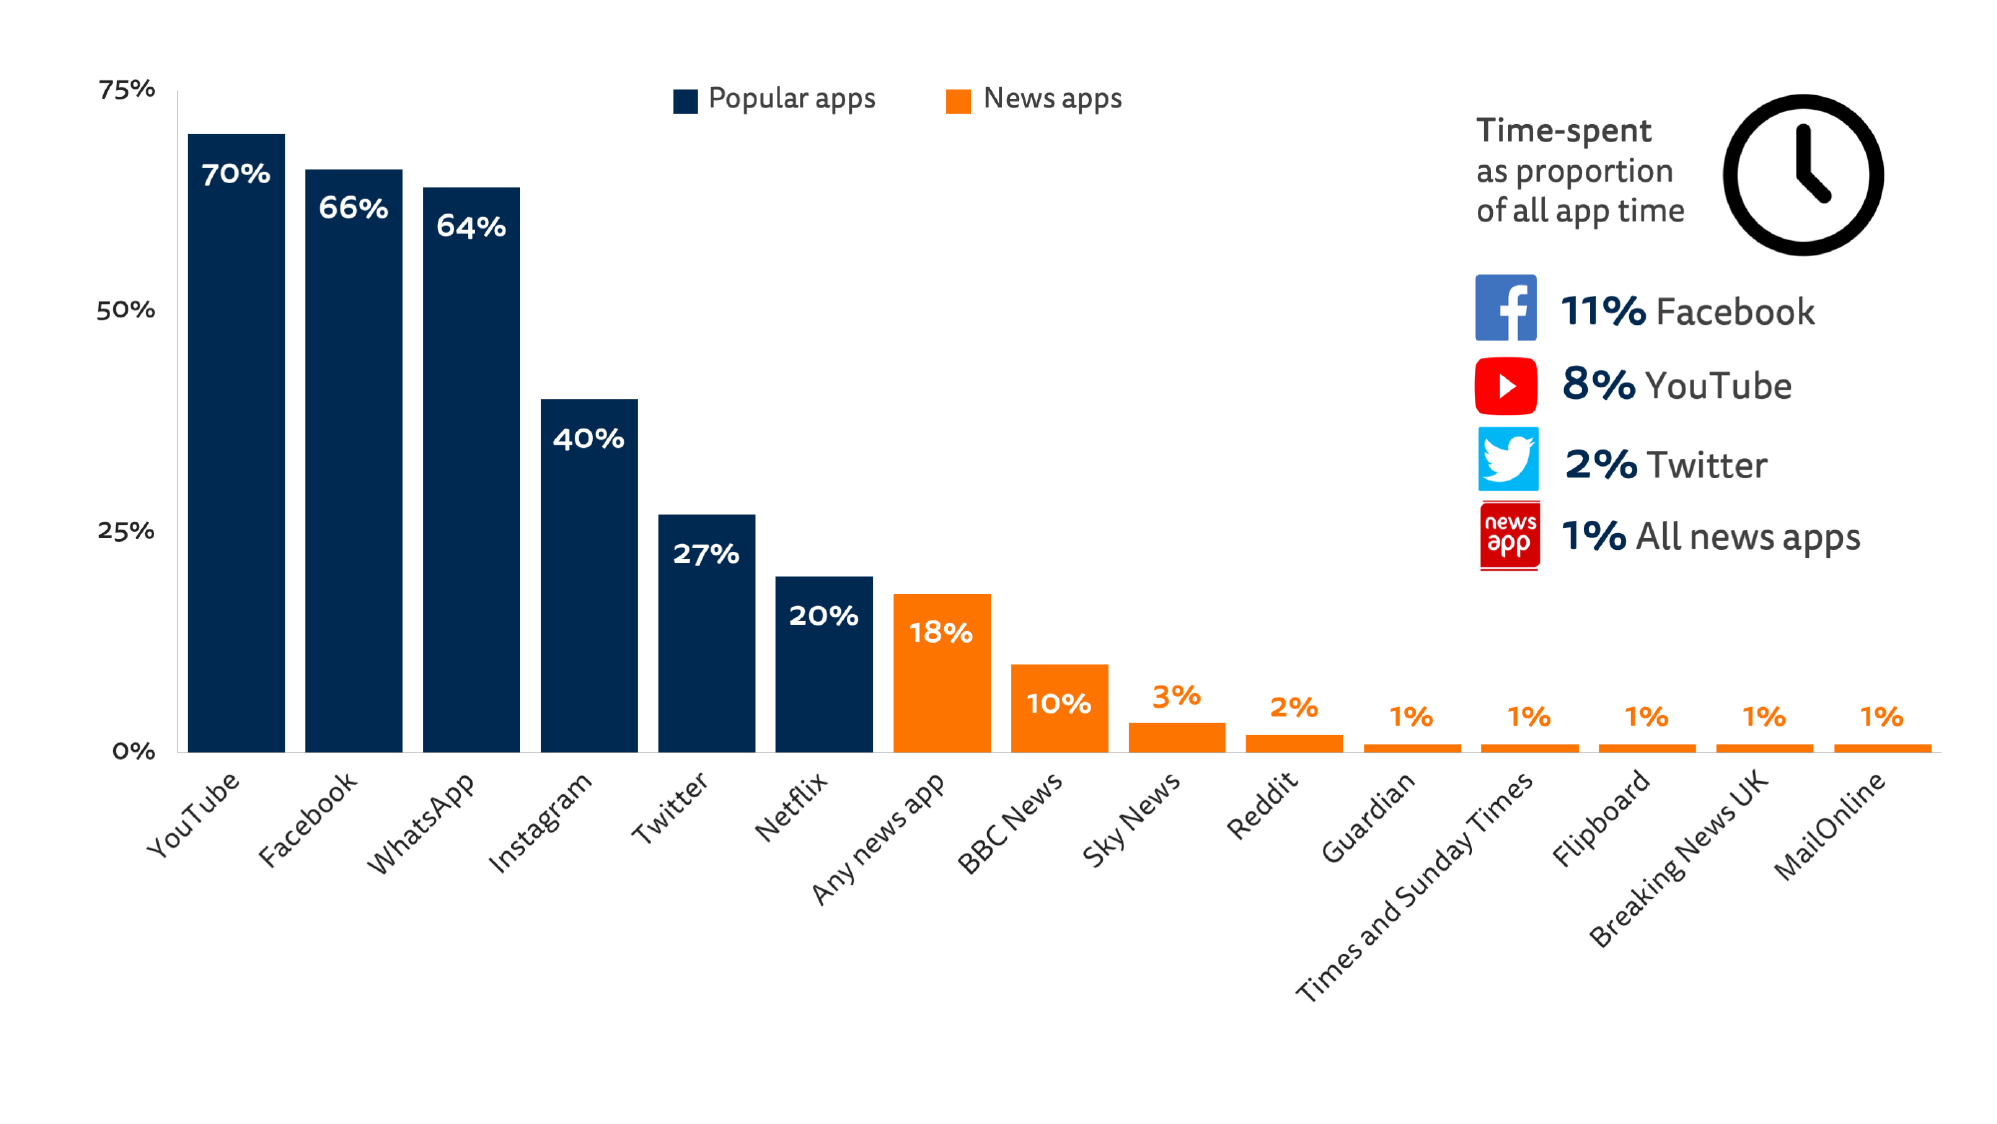 Tracking data. Base: All that accessed the internet using a mobile app between 4 Nov and 15 Dec 2019 = 758.
In total the BBC app accounted for more than half of all news app users. News app users tend to be brand loyalists, older, and more interested in news. Our tracking data show reach of the BBC News app is 6% with 18–24s but as high as 16% with 55-65s.
Despite these significant numbers, far more people used news websites via mobile or desktop browsers. The vast majority are not sufficiently interested in news to download a specific news app. When it comes to apps, it also worth noting how news compares in terms of both reach and time spent with social apps like YouTube, Facebook, WhatsApp, and Twitter. According to our data, under-35s who used Facebook spent on average nearly 3 hours a week using the app during the election period, Instagram users spent just over an hour each week, and Twitter users spent just under an hour. This compares with an average of 30 minutes for this group reading all news apps put together.
When they are using these apps they will, of course, come across news, but according to our survey data, with the exception of Twitter, they are primarily there to connect with friends rather than catch up with news (Fig. 11). It is notable how under-35s consider all of these apps more important for news than older groups – especially Twitter (33%).
Figure 11. Relative importance of news for users of different social platforms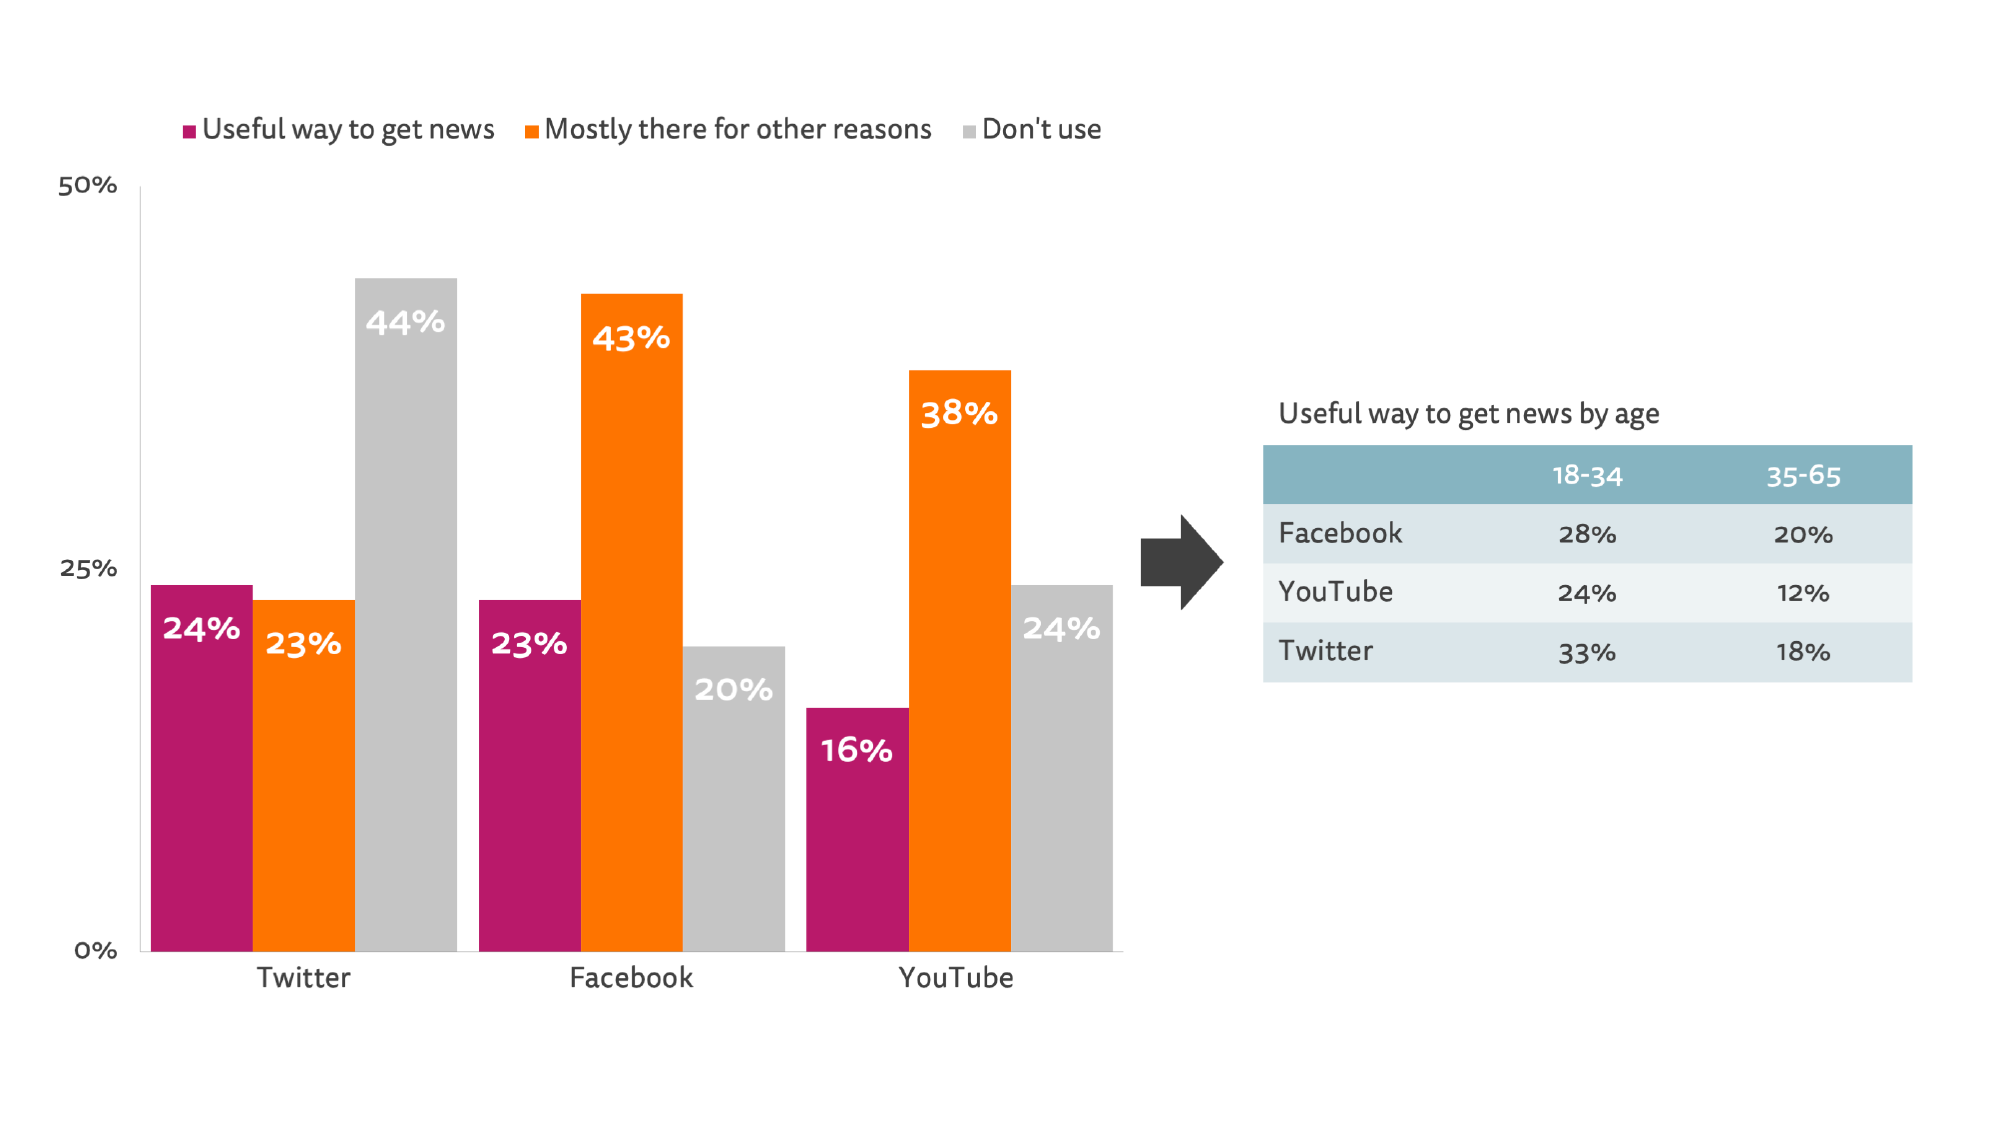
INCIDENTAL_FACEBOOK/YOUTUBE/TWITTER. Which of the following statements applies best to you? I think of <platform> as a useful way to get news. I mostly see news on <platform> when I am there for other reasons. I don’t use <platform> at all. Base: Total survey sample = 752.
Top Stories during the Election
As previously discussed, our methodology measured news usage during the election period from hundreds of designated websites, but this is not the same as measuring election news. To understand the relative interest in the election compared with other stories, we looked at the most viewed 100 stories for each week with our panellists and measured the proportion that were election related.
On average, we find that around four in ten (38%) of the most popular online stories were about the election during the six-week campaign, though this proportion was as high as 61% in the final week (Fig. 13). As previously noted, the period also saw major floods in the North of England, Prince Andrew’s ill-fated interview about his friendship with Jeffrey Epstein, and a terror attack on London Bridge in which two people died. The bulk of the most-read stories – including almost all the top stories each week – came from BBC News, which as we’ve already seen is by far the most used news website in the UK. The most-read story in the period from the start of the campaign to a few days after polling was the BBC’s ‘As it happened’ election results page, which was read by around 4% of the sample. If we also include the month before the campaign, the most-read story was the BBC’s poll-tracker, which was read by around 5% (Fig. 12).
Another successful piece of evergreen content was the BBC’s ‘Who Should I Vote For?’, which enabled users to compare the manifesto commitments of the main parties. This interactive guide was used in similar proportions by younger and older groups and reached about 2% of our sample.
Figure 12. Word cloud drawn from the top headlines and two of the most popular news stories
Figure 13. Top stories by week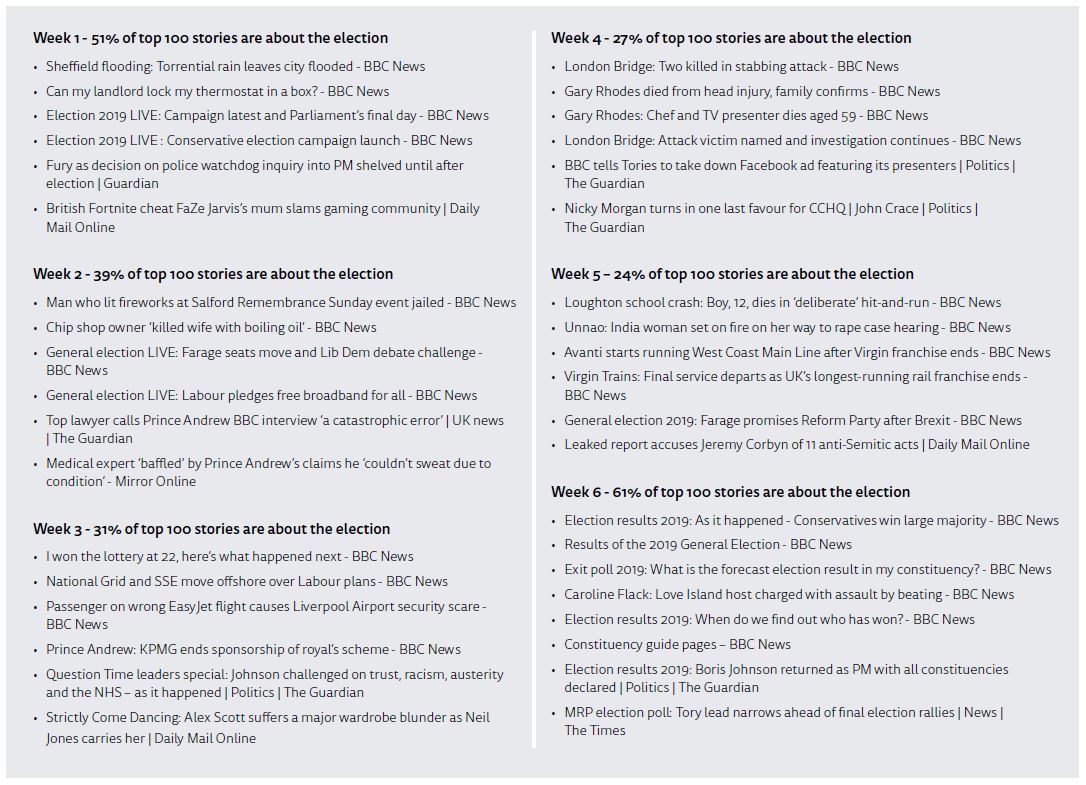 Tracking data. Base: All that accessed a website between 4 Nov and 15 Dec 2019 = 1,666.
On a weekly basis, the most read election stories tended to involve news rather than opinion, with ‘live pages’ run by websites like the BBC and the Guardian accounting for a significant proportion of traffic. These contain a feed of updating posts about developments in the election mixed with social media reactions in reverse chronological order. Our data show that these live pages had dwell-times up to ten times higher than a typical story and many visitors would normally return several times in a day.
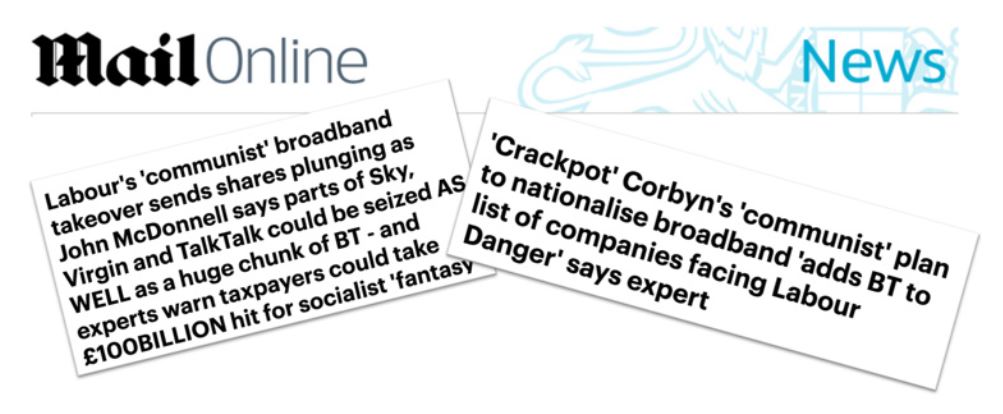
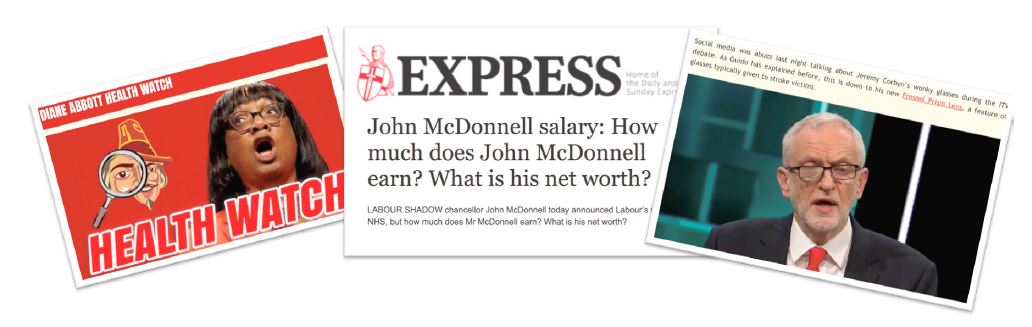
Conservative-supporting media such as the MailOnline chose a political agenda that focused on issues such as anti-Semitism in the Labour Party and the level of spending commitments in the party’s manifesto. News headlines from right-wing media were often overtly partisan, framed as part of a larger narrative around the dangers of a hard-left Corbyn government:
In addition, both left- and right-leaning media from a print background carried opinion pieces with a clear political perspective:
- Dominic Lawson: If you think the NHS is well run, vote Labour | Comment | The Sunday Times
- Marina Hyde: In this climate, how does Boris Johnson not melt with shame | Opinion | The Guardian
Partial headlines, personal attacks on politicians, and overt press support for a particular party may have had some effect in this campaign but our data show that most of these stories gained little reading attention. Brands like the Express achieved some reach over the course of the campaign but its stories accounted for 2% of total reading time. Stories from the MailOnline did attract more attention, though story analysis shows that much of this was for non-election-related news. The Guardian was, if anything, much more influential, with its political coverage achieving high reach with younger voters and appearing regularly in the most-read lists.
Election Results Day
Figure 14 which tracks engagement levels for popular news sites, shows how audiences turned to the BBC for reliable information and analysis as the results came in on election night. Traffic to the BBC was around four times higher than its nearest competitors (the Guardian and MailOnline) during these peak times.
Figure 14. Hour by hour consumption of news websites for election results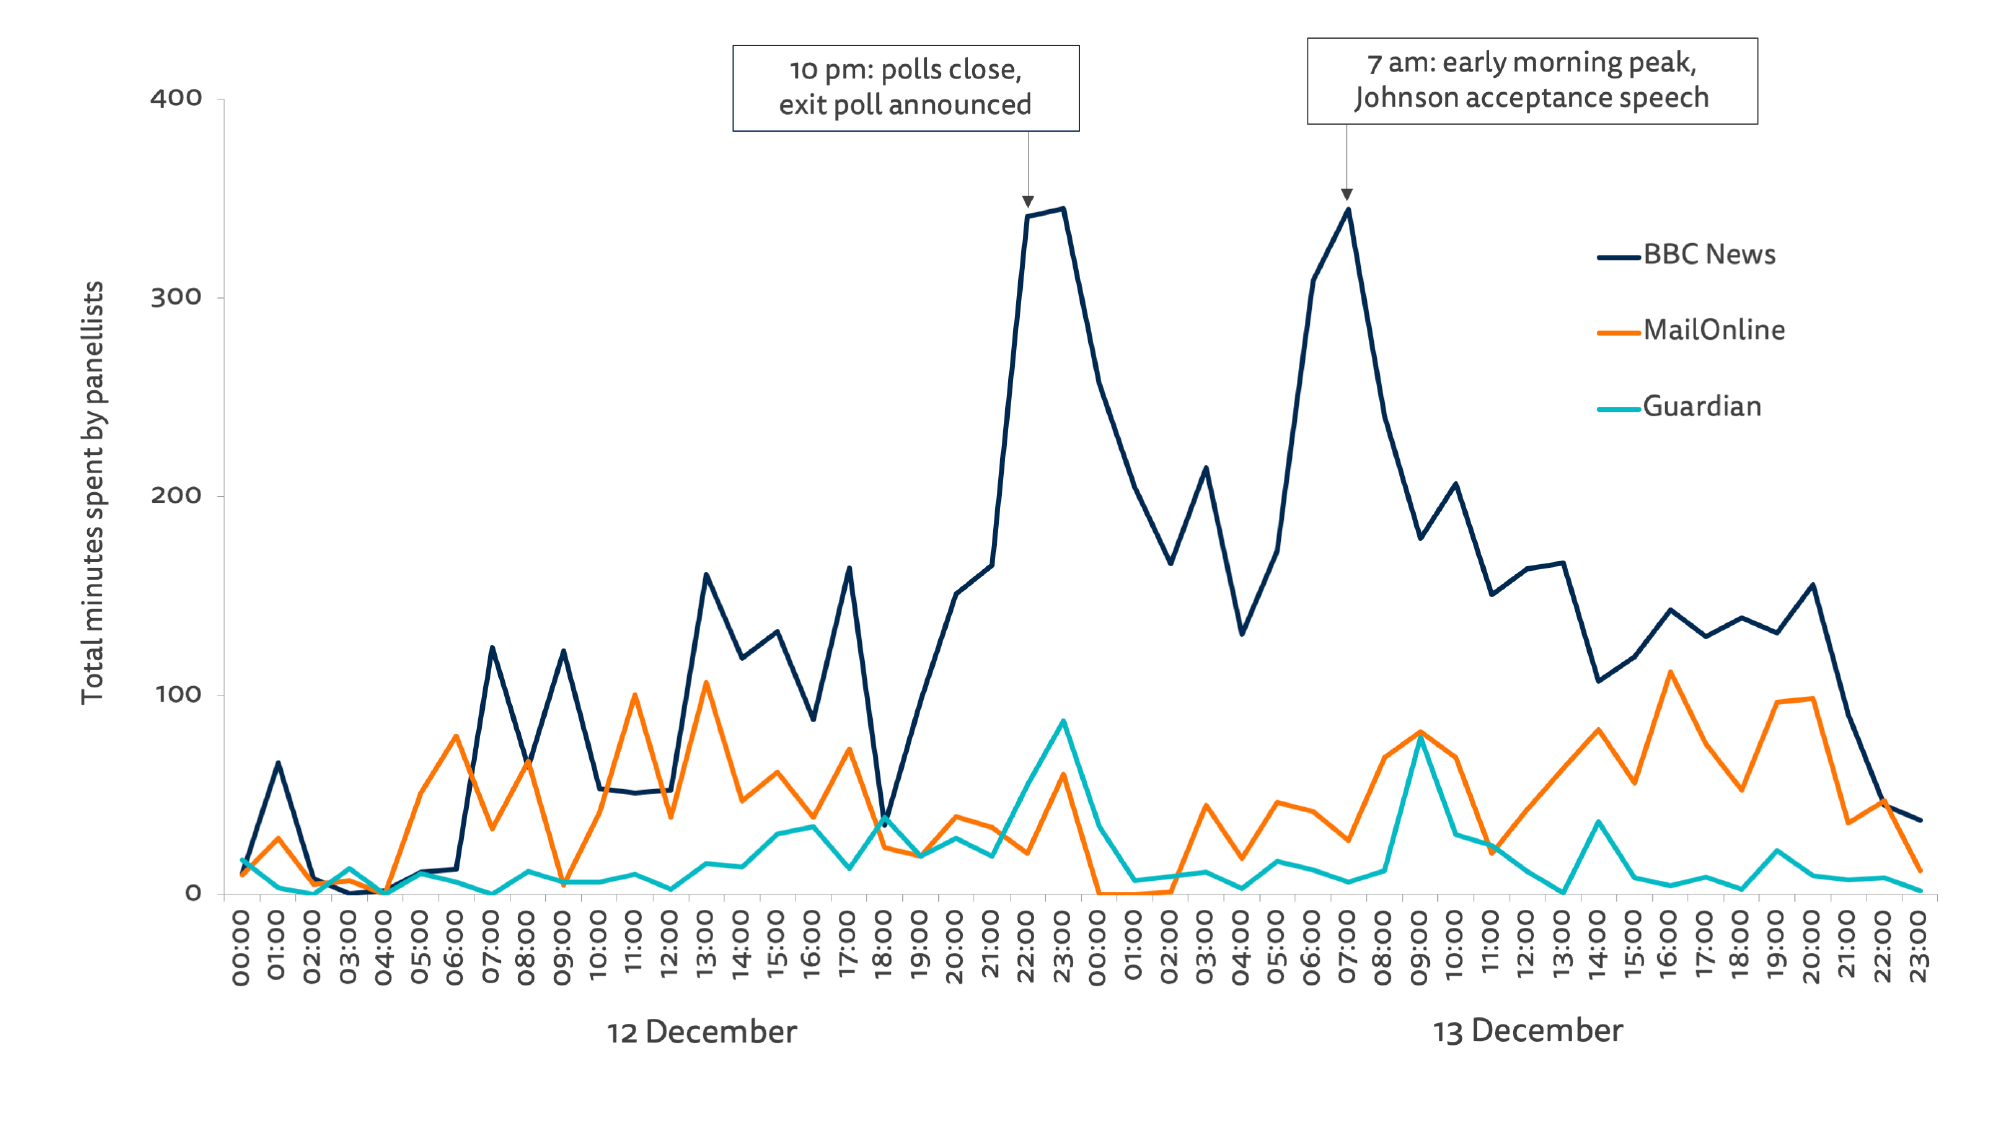 Tracking data. Base: All that accessed a website between 12 Dec and 13 Dec 2019 = 1,243. Note: figures indicate total minutes spent with each site by panellists. A figure of 0 indicates that no panellists used a site in that hour.
By morning, we see another significant peak with online both a supplementary and primary source of news. The bulk of usage came around 7 am, with mobile phones a convenient way to get updates on the national picture and on local results. The peaks for MailOnline and the Guardian came a few hours later, which suggests a certain amount of complementary usage as users looked for additional perspectives and analysis on the results.
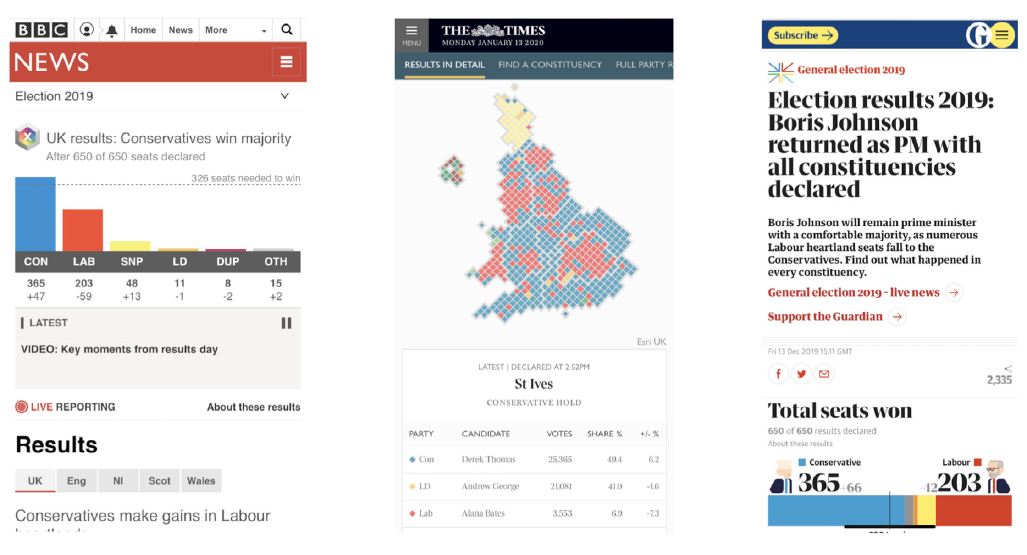
Figure 15. Much of the battle for election traffic was via mobile phones
Election results pages from BBC News, The Times, Guardian
In terms of those who do access the news, the bulk of this appeared to be reportage rather than opinion, and was accessed from mainstream news sites, much of it from those like the BBC with obligations to be impartial. We find little evidence that foreign websites or openly accessible partisan Facebook pages captured much attention online in this election.
3. Selective Exposure and Algorithmic News Selection
All else being equal, people tend to consume news from outlets that align with their political views – especially in relatively polarised news environments like the UK. We might expect this to be even more true online, because there’s more choice, and because access is easy and often free. We have previously used time-spent as a measure of attention, but we can also use our tracking data to measure the number of visits people made to different sites during the campaign (Fig. 16). These data show, unsurprisingly, that Labour voters consumed more stories from left-leaning outlets like the Guardian and the Mirror, whereas Conservative voters preferred to access news from right-leaning outlets like MailOnline and the Sun. Voters from both camps made an almost identical number of visits on average to the BBC, which, as we have already seen, was far and away the most popular source of news during the campaign.
Figure 16. Average number of visits during the campaign by vote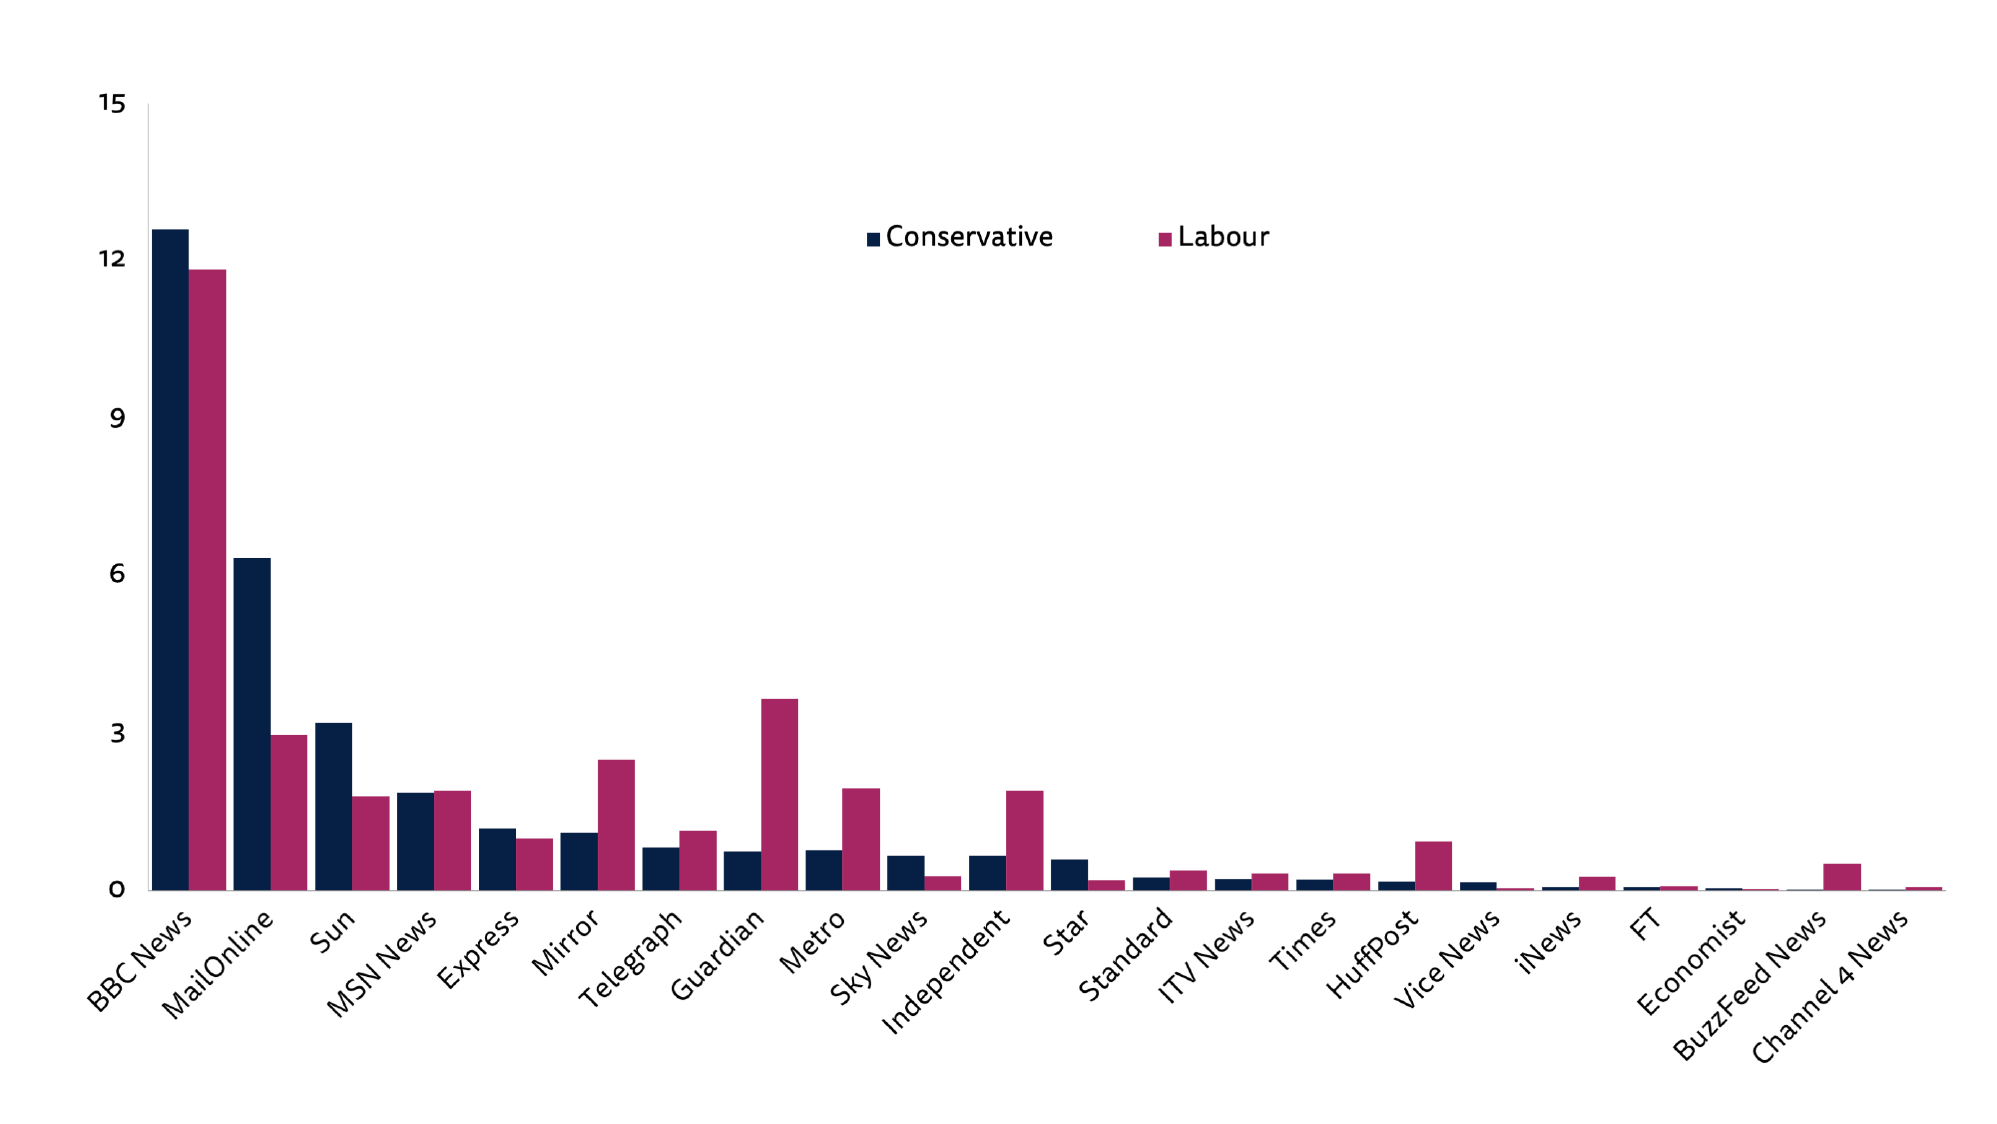 P2019VOTEACTUAL. Which party did you vote for? Base: All tracked survey respondents that voted: Conservative = 191, Labour = 198.
However, it is also clear that people still consume news from outlets that have an opposing editorial line. This means that, although people do engage in what academics call ‘partisan selective exposure’ (that is, exposure to news that supports one’s own view), that does not necessarily mean that they also engage in ‘selective avoidance’ of news that departs from their own views. On top of this, as we saw in Chapter 2, much of the news people saw online during the campaign was from sources like the BBC who are obliged to be politically impartial.
In the UK, most newspapers openly endorse either Labour or the Conservatives during election campaigns, and actively encourage their readers to vote for them (see full list in Chapter 2). In 2019, the Mirror and the Guardian endorsed Labour, for example, whereas the Daily Mail, The Times, and the Sun backed the Conservatives.
This allows us to code many of the most popular UK news outlets, and map the use of each by vote choice. When we do this, we see remarkably similar patterns online and offline. Offline, the most widely used news sources during the campaign were those – like the BBC – that are required to be impartial (Fig. 17). And online people on average made more visits to outlets that were politically neutral (Fig. 18). Conservatives had a clear preference for outlets that endorsed Boris Johnson and, on average, read very few articles from outlets that endorsed Jeremy Corbyn. But interestingly, presumably because there are more Conservative-supporting outlets than Labour-supporting outlets, Labour voters on average made more visits to Conservative-supporting outlets than from Labour-supporting ones. This may just be a supply issue, but it is also possible that some Labour voters sought out news from the opposing side in order to better understand why the Conservatives were ahead.
Figure 17. Proportion that used impartial, Conservative, and Labour supporting outlets in the last week of the campaign by vote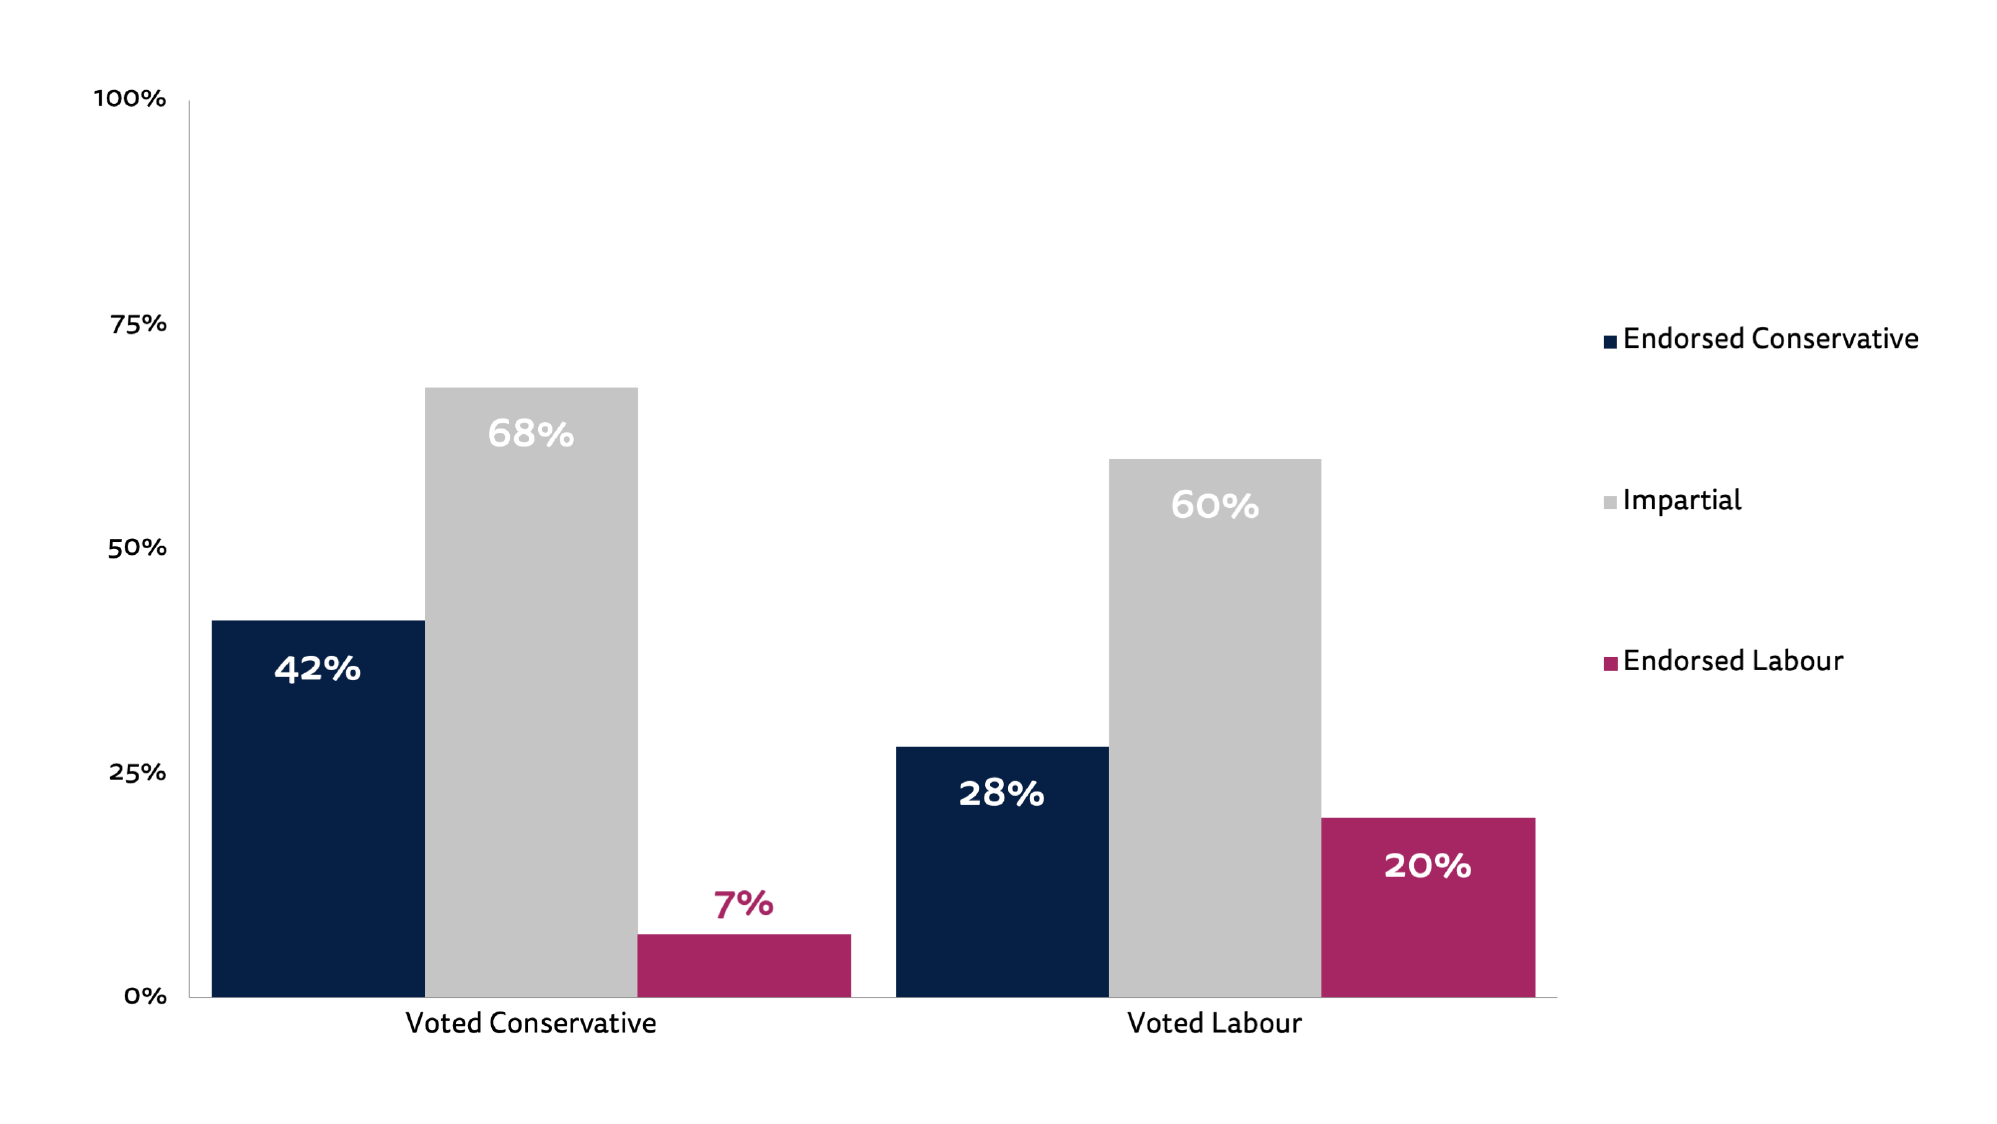 NEWSOFFLINE_POST. Which of the following brands have you used to access news offline in the last week (via TV, radio, print, and other traditional media)? P2019VOTEACTUAL. Which party did you vote for? Base: All survey respondents that voted: Conservative = 213, Labour = 217.
Figure 18. Average number of visits to impartial, Conservative, and Labour supporting sites during the campaign by vote
P2019VOTEACTUAL. Which party did you vote for? Base: All survey respondents that voted: Conservative = 191, Labour = 198.
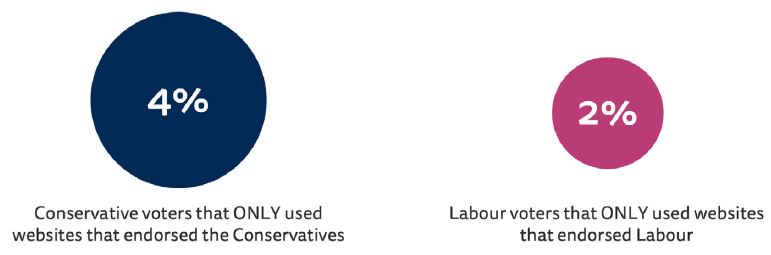
Crucially, almost no one exclusively consumed news from outlets supporting the party they voted for. Just 4% of Conservative voters and 2% of Labour voters only used online news sources supporting their preferred party. Again, this is primarily because most people consume at least some news from impartial outlets – in particular the BBC.
In recent years there has been a concern that people’s online news diets have been narrowed by algorithmic selection on social media and search engines. The fear is that social networks like Facebook and Twitter, and search engines like Google, use data on our past use to infer our preferences, and then use algorithms to feed us news that matches those preferences – trapping us in filter bubbles where we only ever see news from outlets we like or agree with. However, most empirical research fails to find any evidence of this, and our data from the 2019 election campaign are no different.
If we look at tracking data showing the number of online news sites accessed during the campaign, we see that people who use social media for news accessed more online news sources than those who did not, despite reading a similar number of news stories. Similarly, those who say they use search engines to search for news topics were also found to access a higher number of different outlets (Fig. 19).
Figure 19. Average number of online news outlets used during the campaign by social media and search engine users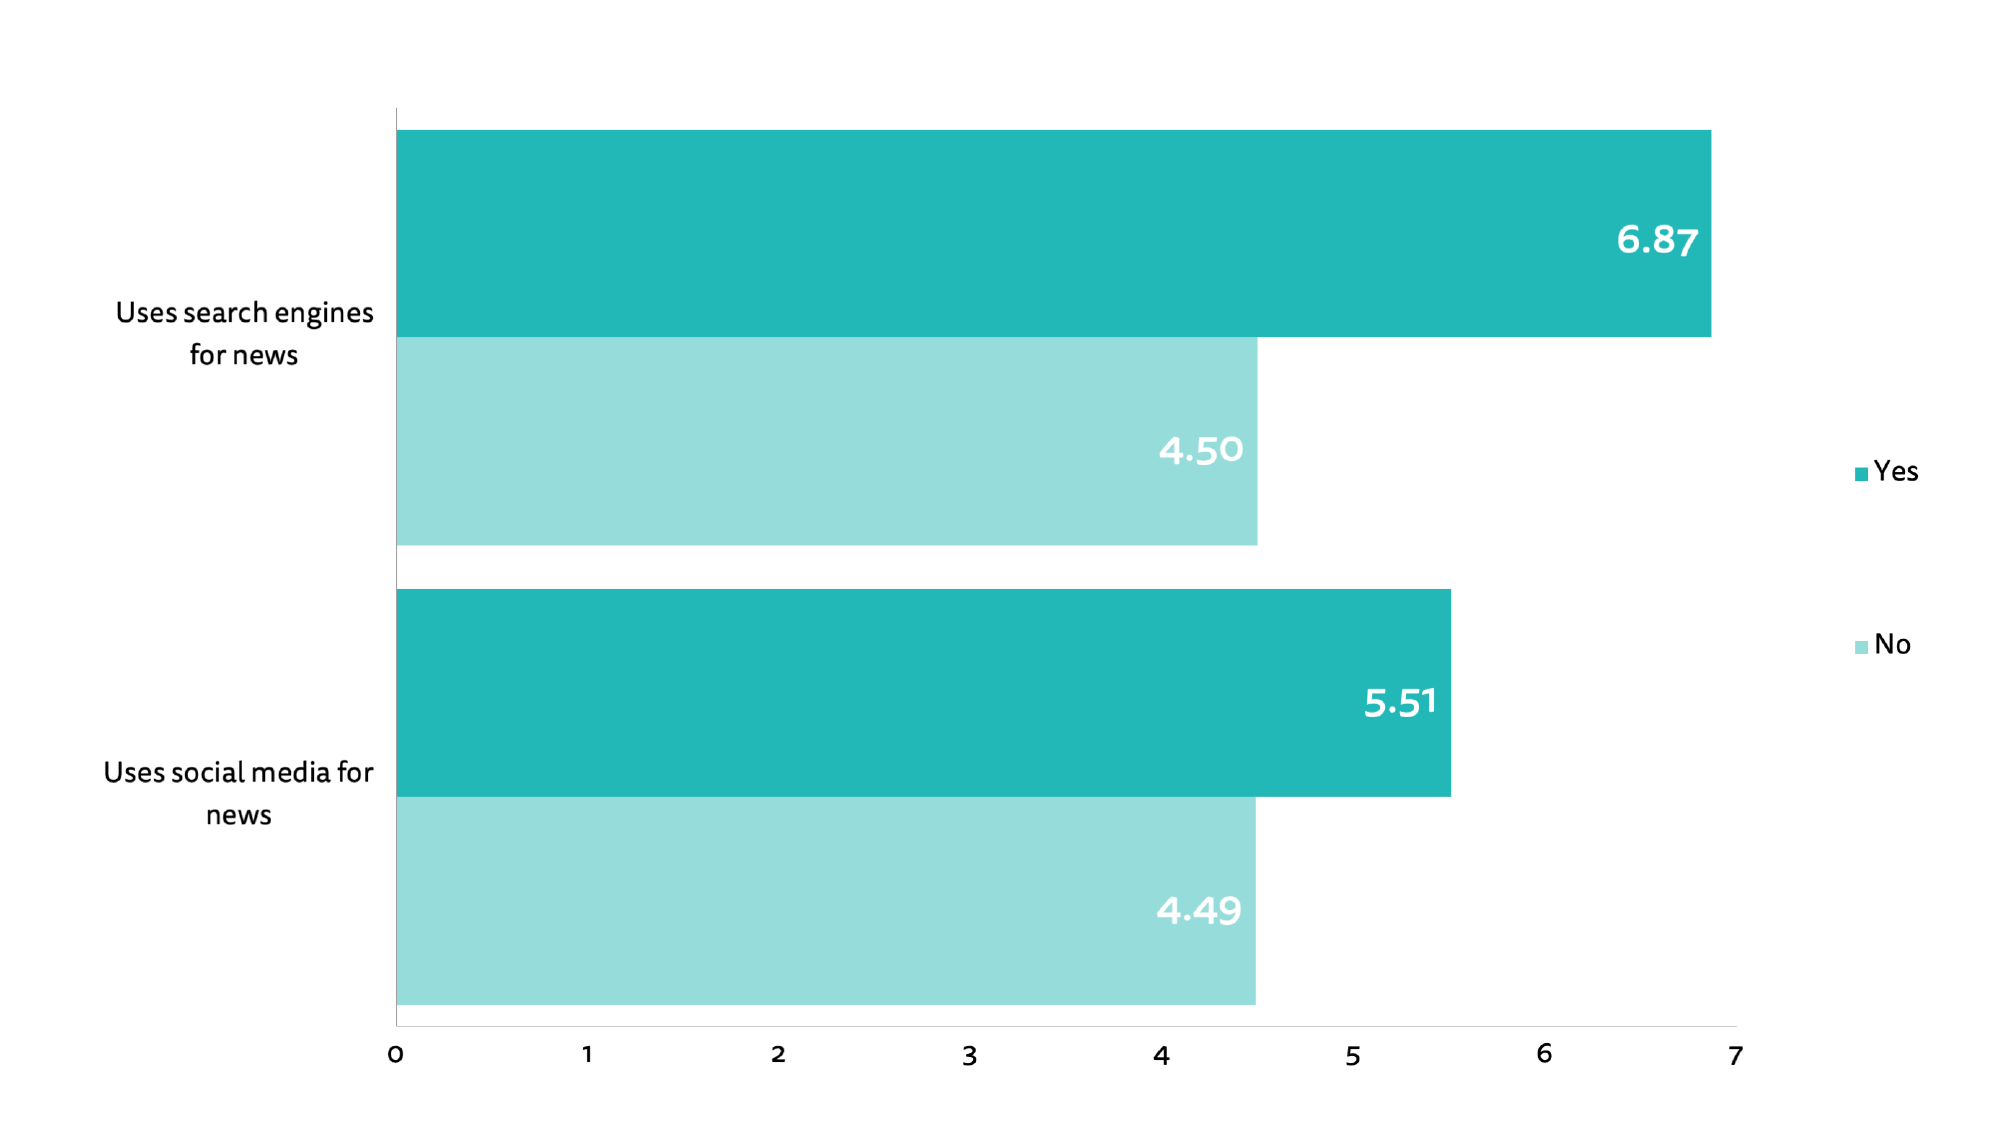 GATEWAYS_POST. Thinking about how you got news online (via computer, mobile or any device) in the last week, which were the ways in which you came across news stories? Base: All that used search/social for news in the last week: Yes = 86/238, No = 663/511.
Of course, simply accessing more online news outlets does not necessarily indicate diversity if people end up using outlets that are very similar. However, the tracking data suggest that the opposite is happening. Returning to our earlier coding of online news outlets based on which party they endorsed in the campaign, we can count the number of visits to Conservative outlets by Labour voters, and visits to Labour outlets by Conservative voters, and call that number cross-cutting news exposure. When we do this, we see that voters who used social media for news had higher levels of cross-cutting news exposure on average than people who did not (Fig. 20). In other words, people who use social media for news consumed more news from the opposing camp rather than less.
Figure 20. Average number of cross-cutting news visits by social media users during the campaign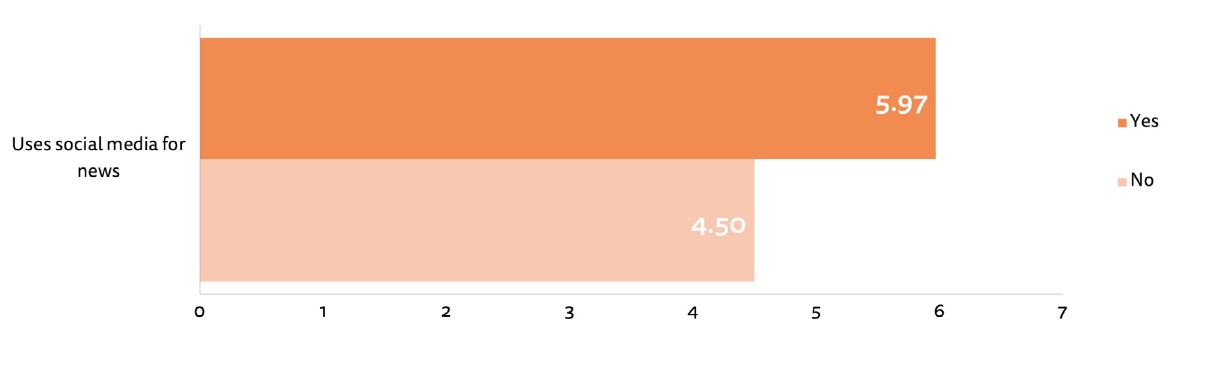 GATEWAYS_POST. Thinking about how you got news online (via computer, mobile or any device) in the last week, which were the ways in which you came across news stories? P2019VOTEACTUAL. Which party did you vote for? Base: All tracked Conservative and Labour voters that used social for news in the last week: Yes = 123, No = 266.
Ultimately, this means that social media news users had more balanced news diets during the campaign. People who do not use social for news consume lots of news from outlets that endorsed the party they voted for (congruent outlets), but less than half as much from outlets that endorsed the other side (cross-cutting outlets). However, people that do use social for news consume almost as much news from cross-cutting outlets as they do from congruent outlets (Fig. 21).
Figure 21. Balance between average number of visits to congruent and cross-cutting news outlets during the campaign GATEWAYS_POST. Thinking about how you got news online (via computer, mobile or any device) in the last week, which were the ways in which you came across news stories? P2019VOTEACTUAL. Which party did you vote for? Base: All tracked Conservative and Labour voters that used social for news in the last week: Yes = 123, No = 266.
4. Trust and Misinformation
Trust in the news and trust in politics are tightly linked, so we would expect to see election coverage influence people’s attitudes towards the media. And given that there were several controversies directly involving the news media this time around, some observers expected trust in the news to fall during the campaign. However, it’s far from clear whether events that can be big news for those in the media world – like video editing mistakes, replacing politicians with ice-sculptures, and inaccurate tweets – really cut through to the public at large, nor even that events that take place during election campaigns really have any kind of lasting effect on attitudes towards the media.
Across the whole survey sample, the proportion that say they trust most news most of the time hardly changed from 42% at the start of the campaign, to 40% by the end. This matches the figure of 40% from our 2019 Digital News Report, the data for which were collected roughly 12 months ago. And even if there was evidence of a decline in media trust during the campaign, this would have to be interpreted alongside data showing that trust in the news in the UK has steadily fallen from 51% in 2015.
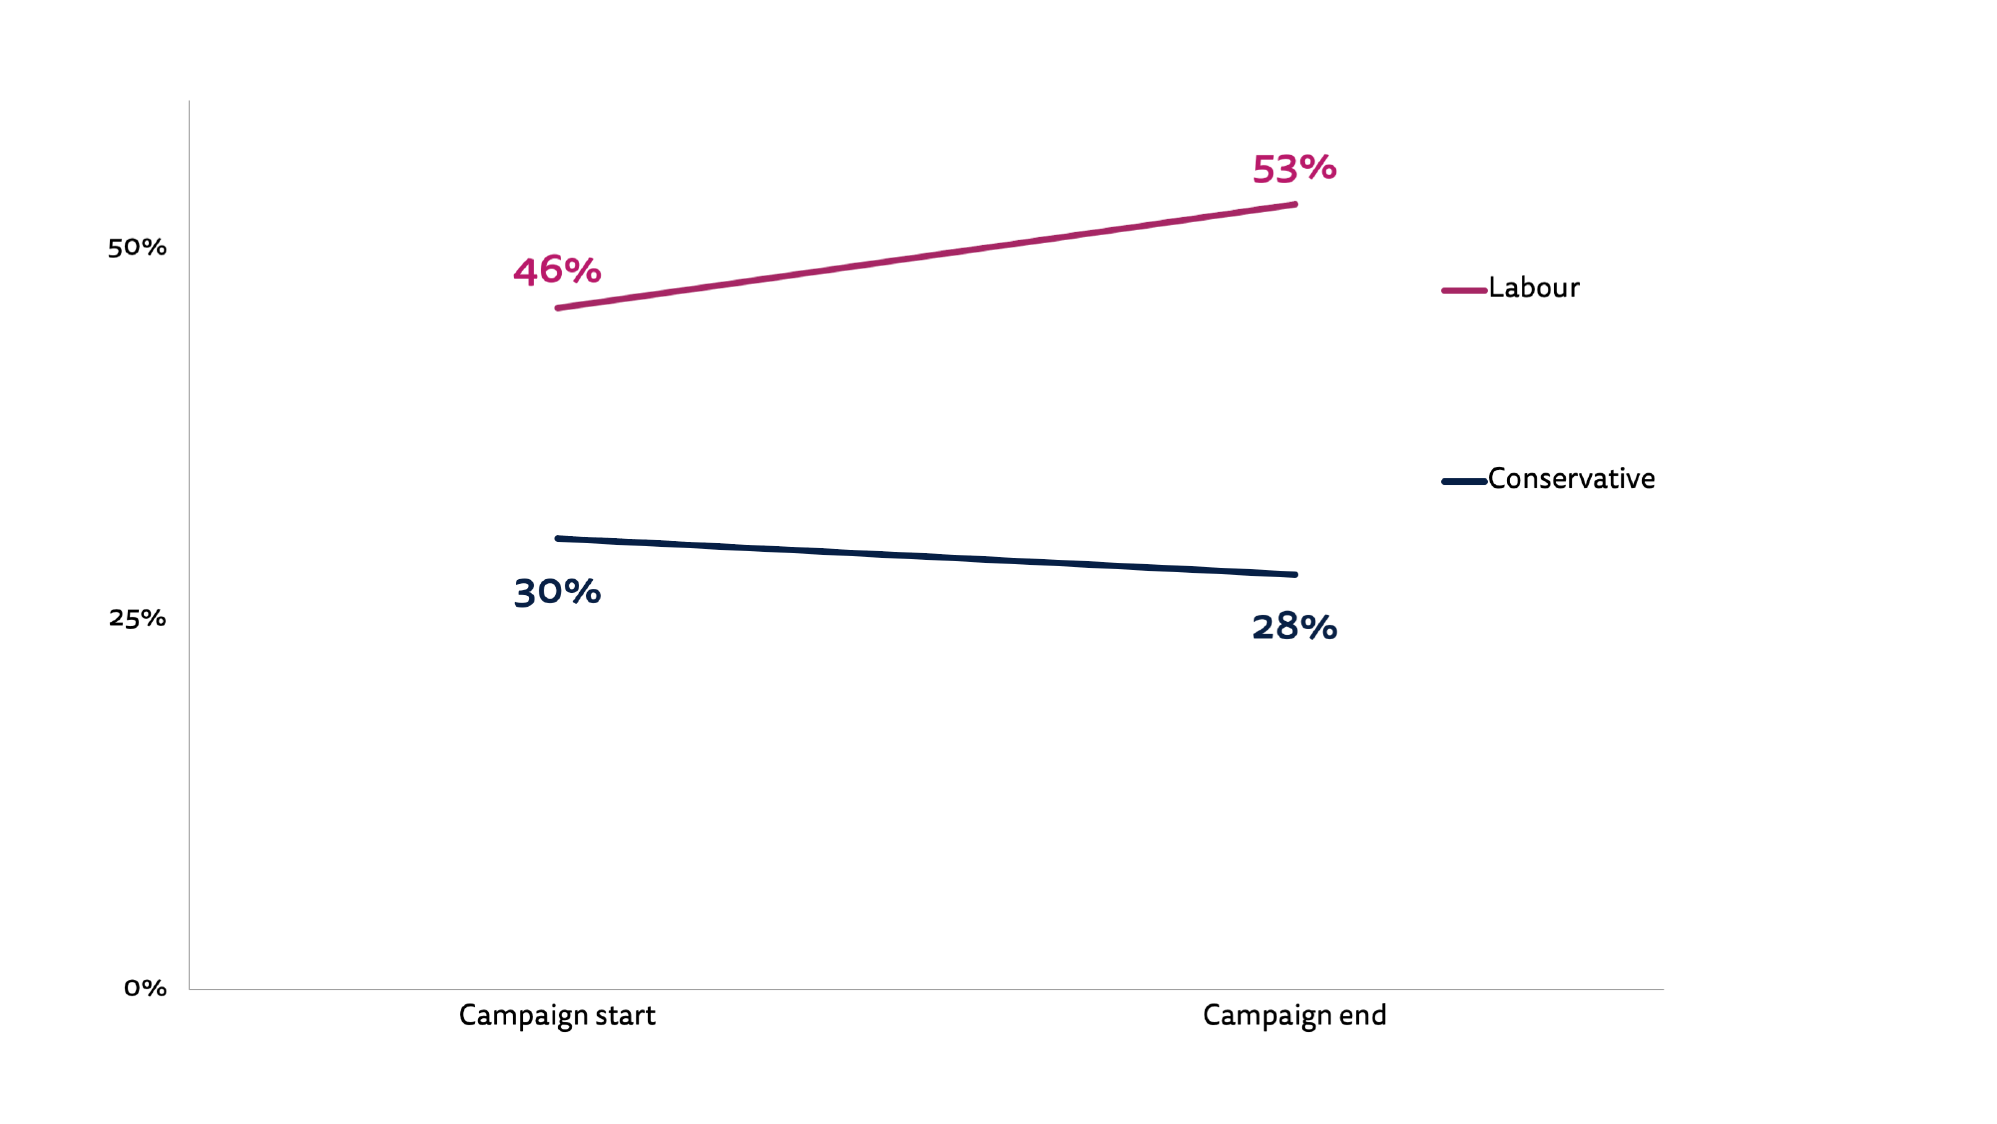
But this high-level view masks the emergence during the campaign of important differences in trust between voters for different parties. The proportion of Labour voters that trust the news fell by 5 percentage points over the course of the campaign, whereas the trust among Conservative voters actually increased by 6 points – creating an 11-point gap after polling day (Fig. 22). Trust in politicians, which is much lower on average, followed a similar pattern. This could be because some of the media stories during the election – such as the BBC mistakenly editing out of a news bulletin the Question Time audience laughing at Boris Johnson – suggested (at least to some) a bias in favour of the Conservatives. Or it could just be that Labour voters were feeling disappointed by the result, in which case we might expect the figures to converge again in a few months.
Figure 22. Proportion that trust most news most of the time by vote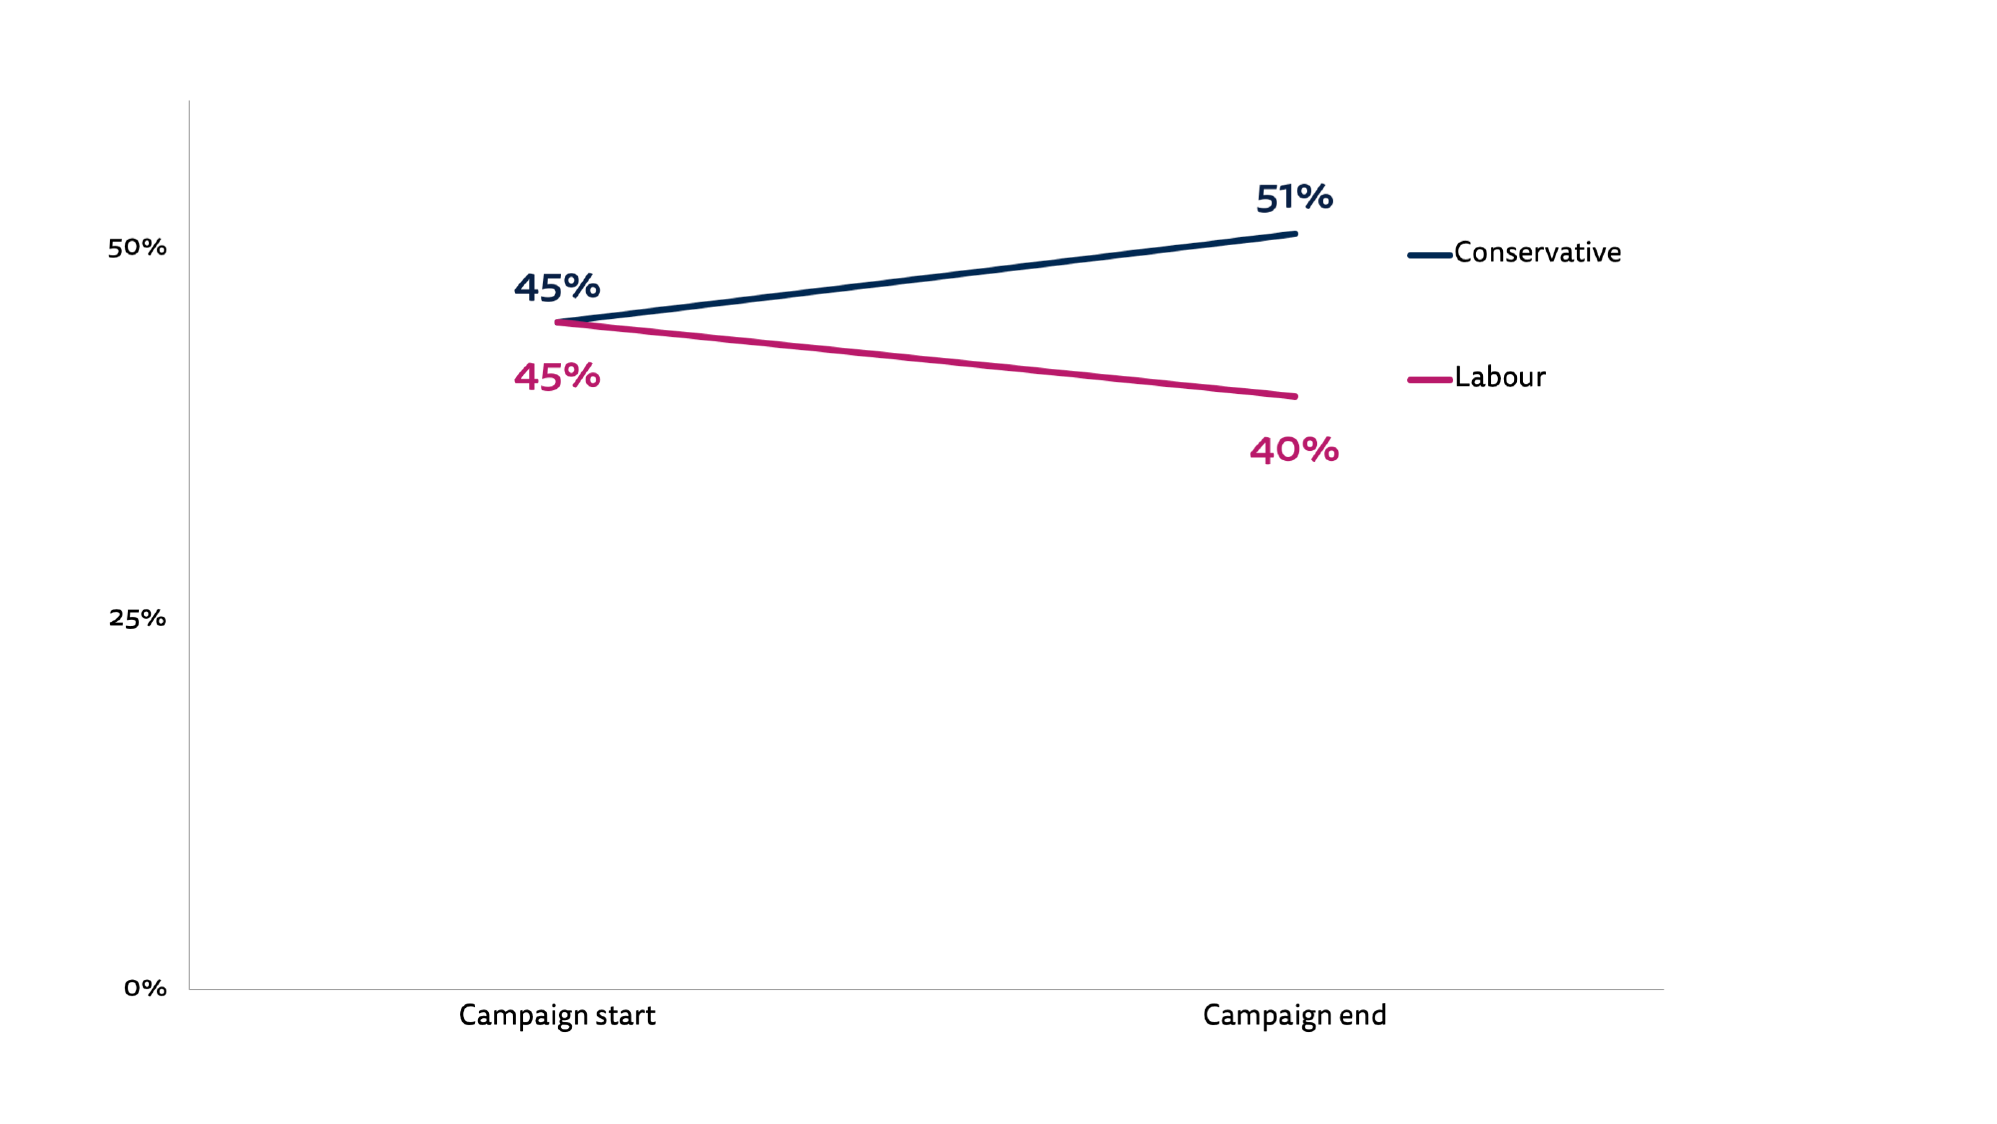 NEWSTRUST_1/ NEWSTRUST_POST_1. To what extent do you agree, if at all, with the following statements? – I think you can trust most news most of the time. P2019VOTEACTUALPARTY. Which party did you vote for? Base: All survey respondents that voted: Conservatives = 213, Labour = 217.
By Western and Northern European standards, trust in the news is relatively low in the UK and this has a knock-on effect for how well people think the news media perform certain tasks. When it comes to the coverage of the election, between 30% and 40% thought that the media as a whole did a good job (Fig. 23), and a small minority thought it did poorly – but many people do not really have strong views either way, with around 40% saying the media neither did particularly well nor particularly badly, or that they don’t know.
Figure 23. Proportion that agree that news media did a good job of the following: ELECTIONCOVERAGE_1-5. Thinking about the way the news media covered the General Election, to what extent do you agree, if at all, with the following statements? The news media did a good job of … Base: Total survey sample = 752.
Once again, we see evidence of differences by party support, with Labour voters expressing a less favourable view of the media coverage than Conservatives when it comes to factchecking politicians, making the election interesting, and explaining how policies would affect people (Fig. 24). But again, time will tell as to whether these differences reflect a temporary reaction to the result or more permanent shifts in attitudes.
Figure 24. Proportion that disagree that news media did a good job of the following by vote choice
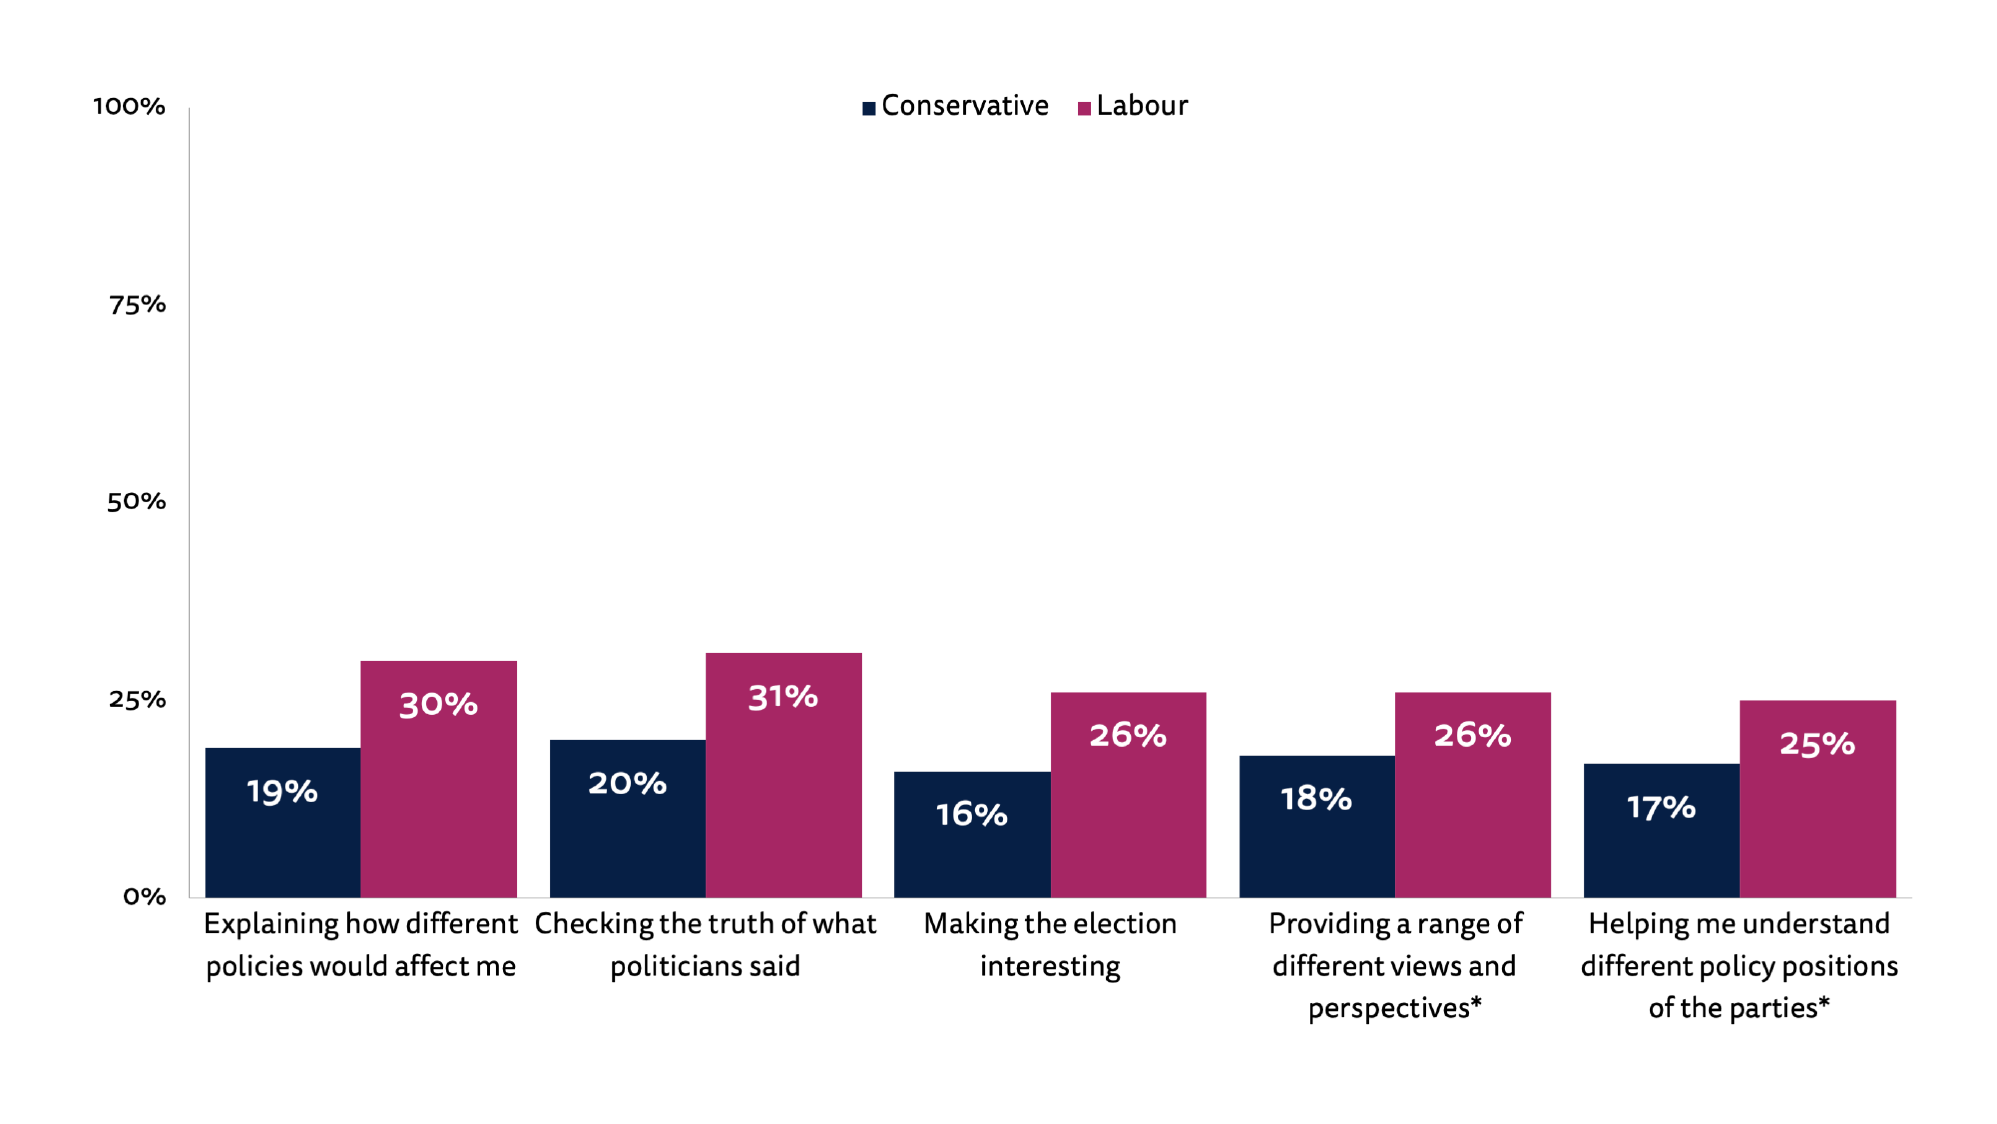
ELECTIONCOVERAGE_1-5. Thinking about the way the news media covered the General Election, to what extent do you agree, if at all, with the following statements? The news media did a good job of … P2019VOTEACTUALPARTY. Which party did you vote for? Base: All survey respondents that voted: Conservatives = 213, Labour = 217. Note. * Difference not statistically significant (p > .05).
We also asked people how well they thought each news outlet covered the election generally. Most of the news outlets we asked about fare well here, with more people rating them favourably than unfavourably (Fig. 25). In line with our earlier findings about the importance of television during the campaign, people rated broadcasters most favourably of all. Most broadsheet newspapers also were mainly seen as having done a good job, but it is important to make clear that, for the majority of brands, most people do not really have an opinion of their coverage for the simple reason that they did not consume any of it.
Figure 25. Proportion that think each outlet did a good job of covering the election BRAND_PERFORMANCE_1-15. Do you think the following news outlets did a good job or a bad job in covering the 2019 UK General Election? Base: Total survey sample = 752.
Many media observers believe that the BBC had a poor election. Their campaign coverage was placed under unprecedented levels of scrutiny, as people used video recording technology and archived footage to highlight anything that could be construed as biased. Mistakes initially went viral on social media and were later reported on by the press, creating the impression in some circles that the public were becoming increasingly hostile towards the BBC’s political coverage.
However, this impression is not strongly reflected in public opinion. Just under half (43%) of 18–65s thought that the BBC did a good job of covering the election, whereas just 14% thought it did badly. The 14% figure is quite high compared to most other brands, but more people have an opinion of the BBC, and the ratio of good to bad evaluations is still high (but lower than for ITV, Channel 4, and Sky).
Criticism of the BBC is often expressed most strongly on social media. Indeed, people who say they use social media for news are around twice as likely as non-users (19% compared to 11%) to think that the BBC did a poor job of covering the election (Fig. 26) – with much smaller gaps if we cut the data by demographic variables like age and gender. This is not to say that social media is in any way causing people to acquire an unfavourable opinion (we don’t know), but it highlights how conversations on social networks like Twitter can provide a misleading view of public opinion.
Figure 26. Proportion that think the BBC did a good job of covering the election by social media use for news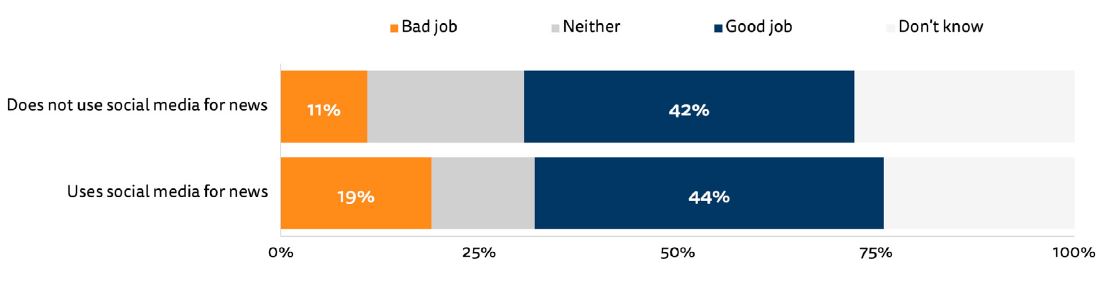 BRAND_PERFORMANCE_1. Do you think the following news outlets did a good job or a bad job in covering the 2019 UK General Election? BBC News. GATEWAYS_POST. Thinking about how you got news online (via computer, mobile or any device) in the last week, which were the ways in which you came across news stories? Base: All that used social media for news in the last week: Yes = 238, No = 511.
The Role of Misinformation in the Election
Misinformation, disinformation, and fake news have not dominated the post-election conversation in the way they dominated discussions following the Brexit referendum and the US presidential election in 2016. The fact that the result was not as close as many people expected has probably taken the focus away from things that could otherwise be seen as having tipped the balance one way or the other. But at the same time, the campaign was full of incidents, promises, claims, and counter-claims that kept fact-checkers busy and often left journalists and other observers scratching their heads.
Analysis of the work of fact-checkers like FullFact and Channel 4’s FactCheck showed that a large number of untruths came from the main parties themselves.4 This is perhaps reflected in the fact that, in our post-election survey, 35% of 18–65s said that they were most concerned about domestic politicians and political parties as a source of misinformation during the election (Fig. 27). Concern expressed here could refer to doubts about manifesto promises, claims made by politicians on the campaign trail, or even the strange decision made by the Conservatives to temporarily turn their official Twitter account into an unofficial fact-checker. Either way, journalists (14%), the public (12%), and activists (9%) did not attract the same level of concern. Just 7% said that they were most concerned about false or misleading information from foreign governments (or those acting on their behalf).
Figure 27. Proportion most concerned about each when it comes to false or misleading information during the election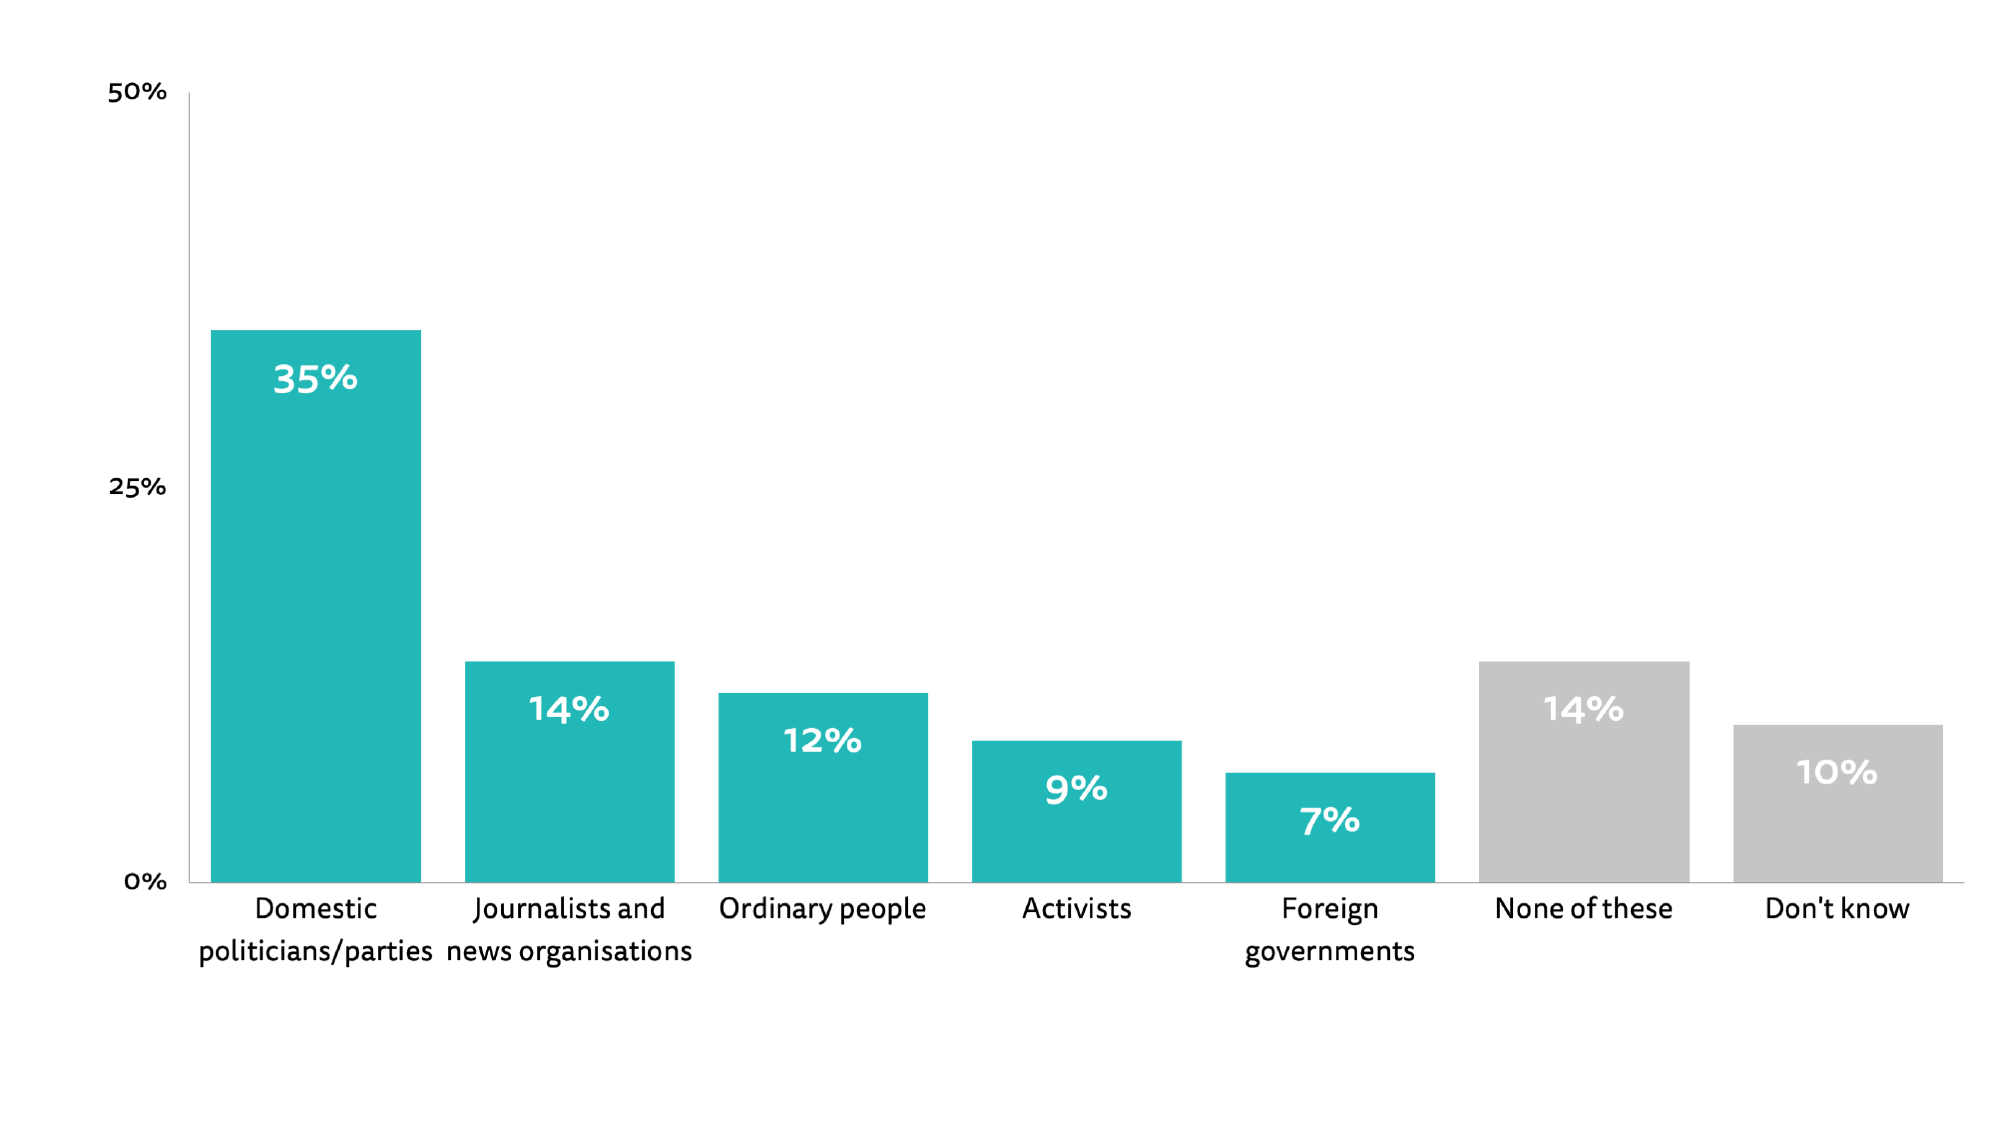 MISINFOCONCERNACTORS. Which of the following, if any, are you most concerned about when it comes to false or misleading information during the 2019 UK General Election? False or misleading information from … Base: Total survey sample = 752.
These figures could reflect what people observed during the campaign, or they could be based on people’s longstanding concerns. Overall, levels of concern over misinformation during the election did not change over the course of the campaign. 37% said that they were ‘very’ or ‘extremely’ concerned about what is real and what is fake at the start of the campaign, but after polling day, the figure was 38%. But as with trust, these top-line figures mask differences among voters. At the start of the campaign, there was a 16 percentage point gap between Labour and Conservative voters in terms of levels of concern over misinformation, but by the time the campaign came to an end, that gap had grown to 25 points as Labour voters became increasingly concerned (Fig. 28).
Figure 28. Proportion very or extremely concerned about online misinformation by vote
 MISINFOCONCERN/MISINFOCONCERN_POST. How concerned are you, if at all, about what is real and what is fake when it comes to news about the most recent UK General Election? P2019VOTEACTUALPARTY. Which party did you vote for? Base: All survey respondents that voted: Conservatives = 213, Labour = 217.
If we return to data from our post-election survey on what people say they are most concerned about, and again split the data by vote choice, we see big differences in the levels of concern about domestic politicians and parties, and levels of concern about activists or activist groups (Fig. 29).
Figure 29. Proportion most concerned about each when it comes to false or misleading information during the election by vote MISINFOCONCERNACTORS. Which of the following, if any, are you most concerned about when it comes to false or misleading information during the 2019 UK General Election? False or misleading information from … P2019VOTEACTUALPARTY. Which party did you vote for? Base: All survey respondents that voted: Conservatives = 213, Labour = 217. Note. * Difference not statistically significant (p > .05).
Recent years have shown how difficult it is to measure exposure to various forms of misinformation – even with access to web tracking data. However, we can use our survey data to measure how often people think they have been exposed to various forms of low-quality information. The data show that Labour voters self-report higher levels of exposure to a variety of different types of low-quality information during the campaign – including poor journalism, stories where facts are spun to push a particular agenda, and stories that are completely made-up (Fig. 30). They were also more likely to say that they had seen the term ‘fake news’ used in an attempt to discredit the news media.
Figure 30. Proportion that thought they were exposed to each during the campaign by vote 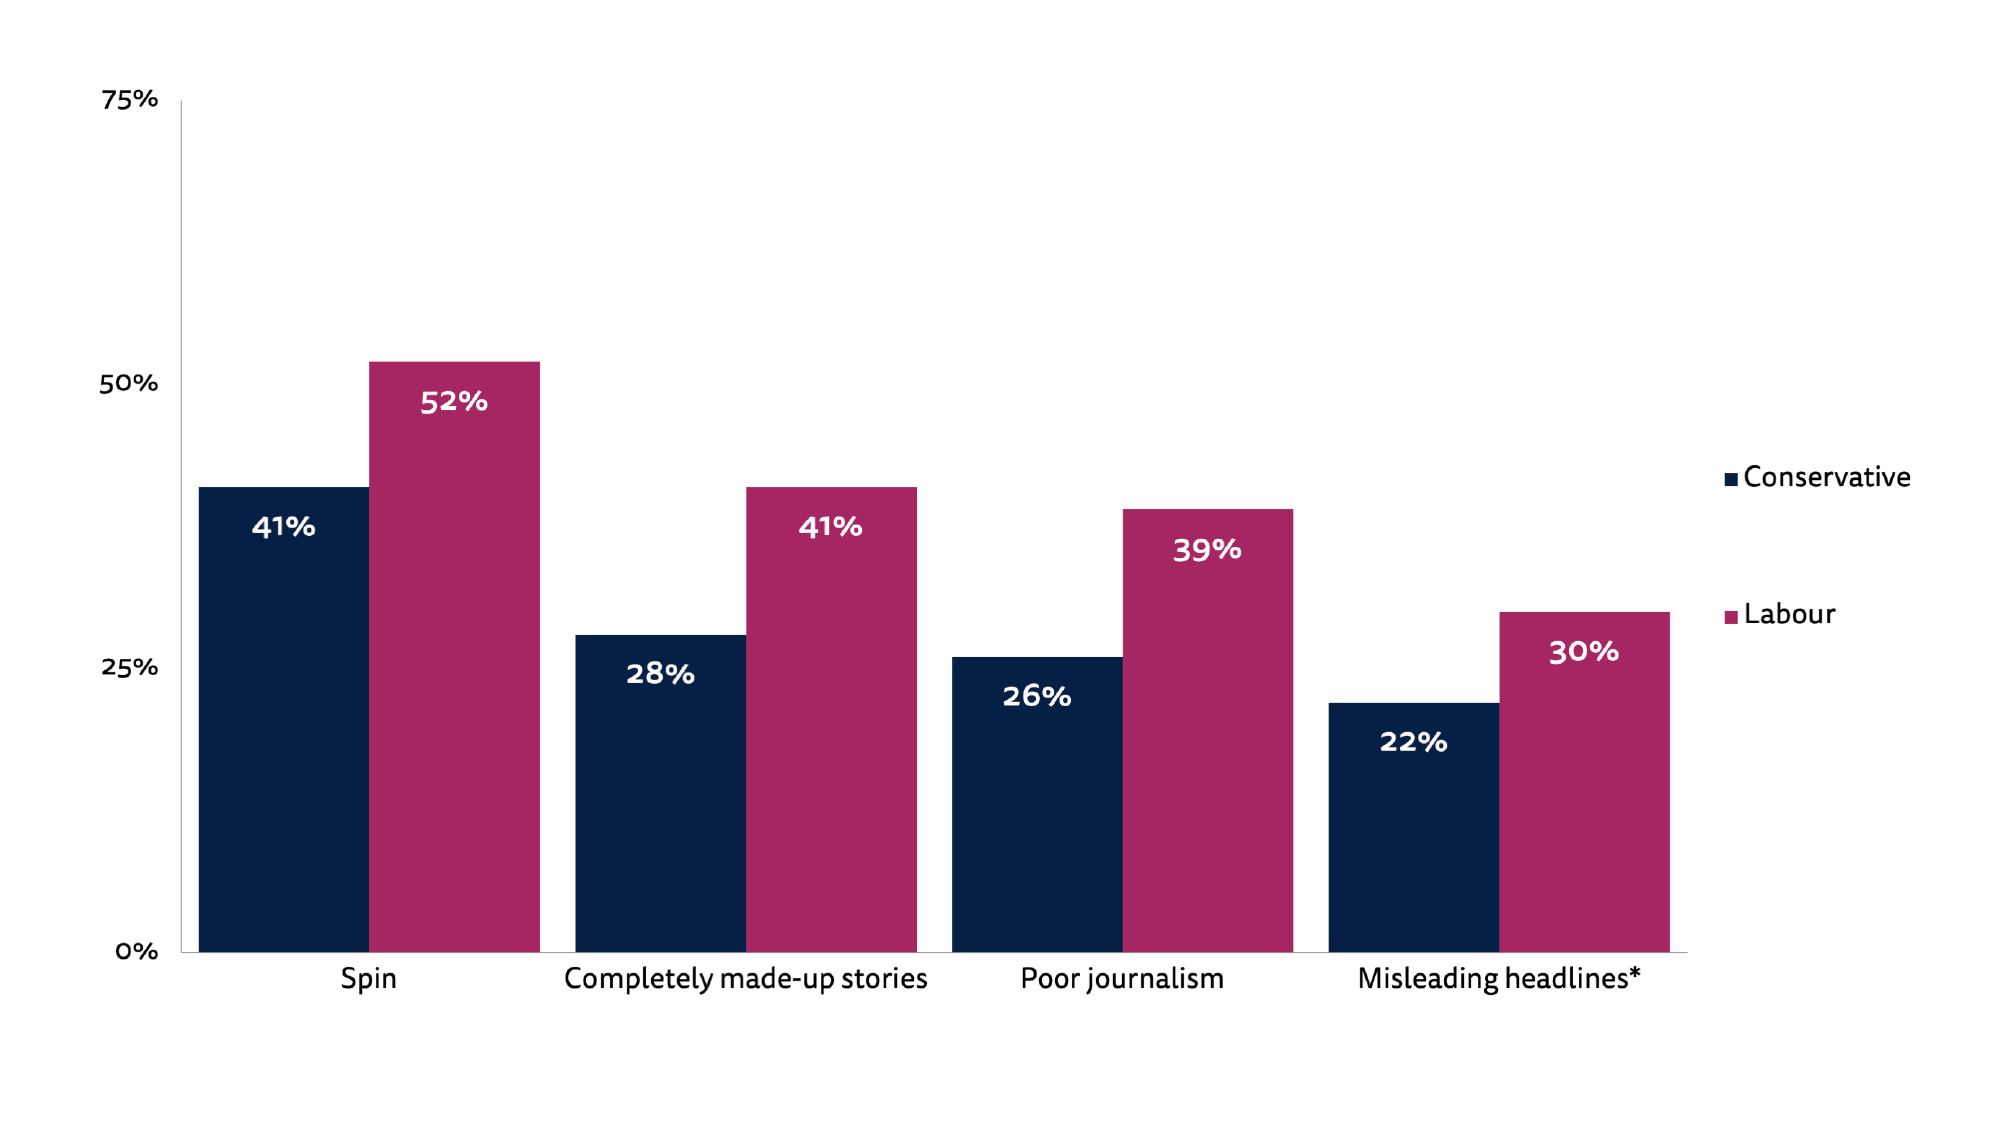 MISINFOEXPOSURE. In the last month which, if any, of the following have you personally come across? Please select all that apply. P2019VOTEACTUALPARTY. Which party did you vote for? Base: All survey respondents that voted: Conservatives = 213, Labour = 217. Note. * Difference not statistically significant (p > .05).
We are able to use the tracking data to measure the use of satirical websites over the course of the campaign. However, the reach of sites like The Poke (2%), The Daily Mash (1%), and News Thump (1%) was relatively small. According to our survey, 21% of respondents said that they had seen ‘stories that are completely made up to make people laugh’ during the last month of the campaign, suggesting that much exposure to satirical news is confined to social media, or occurs offline through TV programmes like Have I Got News for You.
Going into this election many people were deeply concerned about the impact of social media advertisements following intense speculation over whether these had influenced the outcome of the Brexit referendum. Since then, Facebook has changed its rules to make it harder to do micro political targeting, but even so the political parties felt it was worth spending hundreds of thousands of pounds on social platforms during this campaign. Facebook rules now say that the funder of any political message needs to be clearly labelled and most ads themselves are visible in a new transparency portal, which also tracks the amount of money being spent by any particular advertiser. However, Facebook does not take a view on the accuracy of political advertising and the Coalition for Reform in Political Advertising called out campaigns from across the party spectrum as ‘indecent, dishonest or untruthful’. The First Draft coalition found misleading information in 88% of the Conservative Party’s most widely viewed advertisements, with other parties also guilty.5
Figure 31. Examples of social media advertisements, many of which contained dubious claims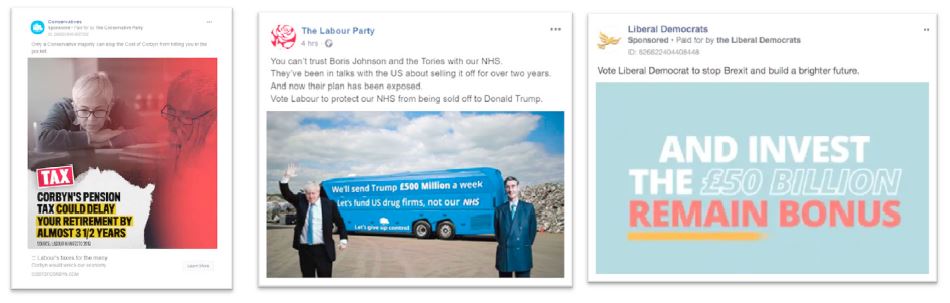
Our survey suggests that around one in seven (14%) remember being exposed to an election-themed social media advertisement, though this rose to 21% amongst those aged 18-34 (Fig. 32).Traditional leaflets were by far the most visible forms of political communication and election broadcasts were also seen by a significant proportion of both young and old – perhaps because they were also distributed via social media.
Figure 32. Self-reported exposure to political communication and political advertising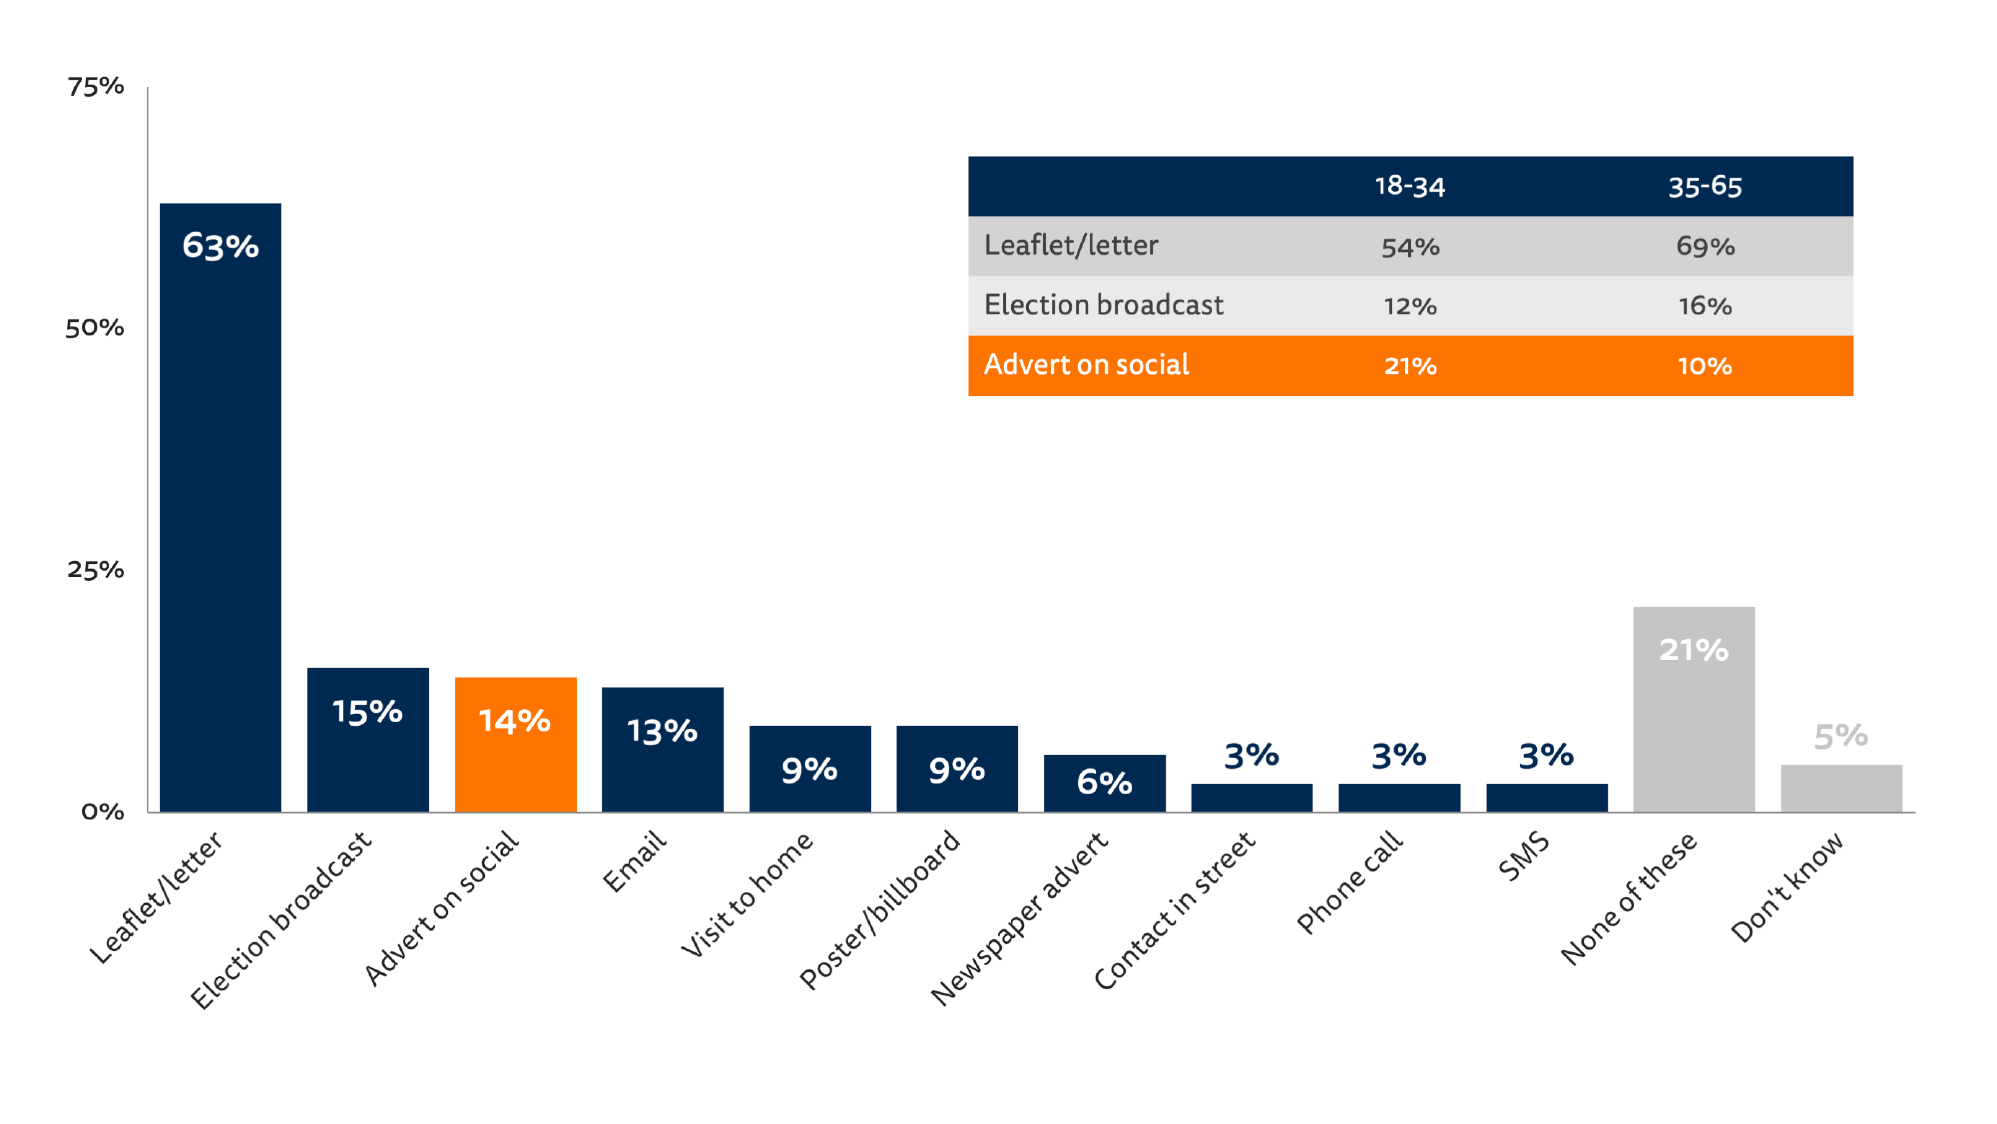 CONTACT. In which of the following ways, if any, have political parties, politicians or campaigners communicated with you in the last month? Base: Total survey sample = 752.
5. Perceptions of Different News Media in the Election
In this chapter we look in more detail at the extent to which people felt different kinds of media had helped inform them during the campaign and equipped them to make their voting choice. A comparison of the different news sources with regard to their helpfulness, emphasises the importance of TV news. Around a quarter (25%) thought TV was the most important source in helping to understand the issues in the election and one in five (20%) agreed that TV was the most helpful source in making a voting decision (Fig. 33).
It is striking that nearly a third of respondents said that no source was particularly helpful. This may be because people had already made up their minds or felt they already understood enough about the issues at stake.
If we put these sources together (Fig. 33, the aggregated table on the right), we can get some sense of the impact of the news media, personal networks (offline and online), and communication from political parties in the context of this campaign. Not many people change their voting intention during the course of any campaign but it is interesting to see how different sources helped inform choices. Almost half of our respondents (46%) felt the media were important in helping them understand the issues, compared with 18% for personal networks and 4% for political parties. About a quarter (23%) said that ‘none of these’ was important. When it comes to helping with the voting decision itself, the media were a little less important (35%), followed by friends and personal networks (19%), and just 4% for direct communication by political parties. In this case, even more (31%) felt none of these sources was helpful.
Figure 33. Level of importance assigned to different information sources ELECTIONUNDERSTAND. Which of the following, if any, was most important for helping you decide who to vote for in the election? ELECTIONCLARIFY. Which of the following, if any, was most important for helping you understand the issues during the election? Base: Total survey sample = 752.
We can see that there are significant differences by age when it comes to the importance of different media. In the next chart (Fig. 34) we can see that the younger groups (18–34) say that they are as likely to find personal networks (friends and social media) helpful in deciding who to vote for as anything they might read or see via the news media. Over-35s found TV considerably more important than news websites or apps.
Figure 34. Most important influence on voting choices by age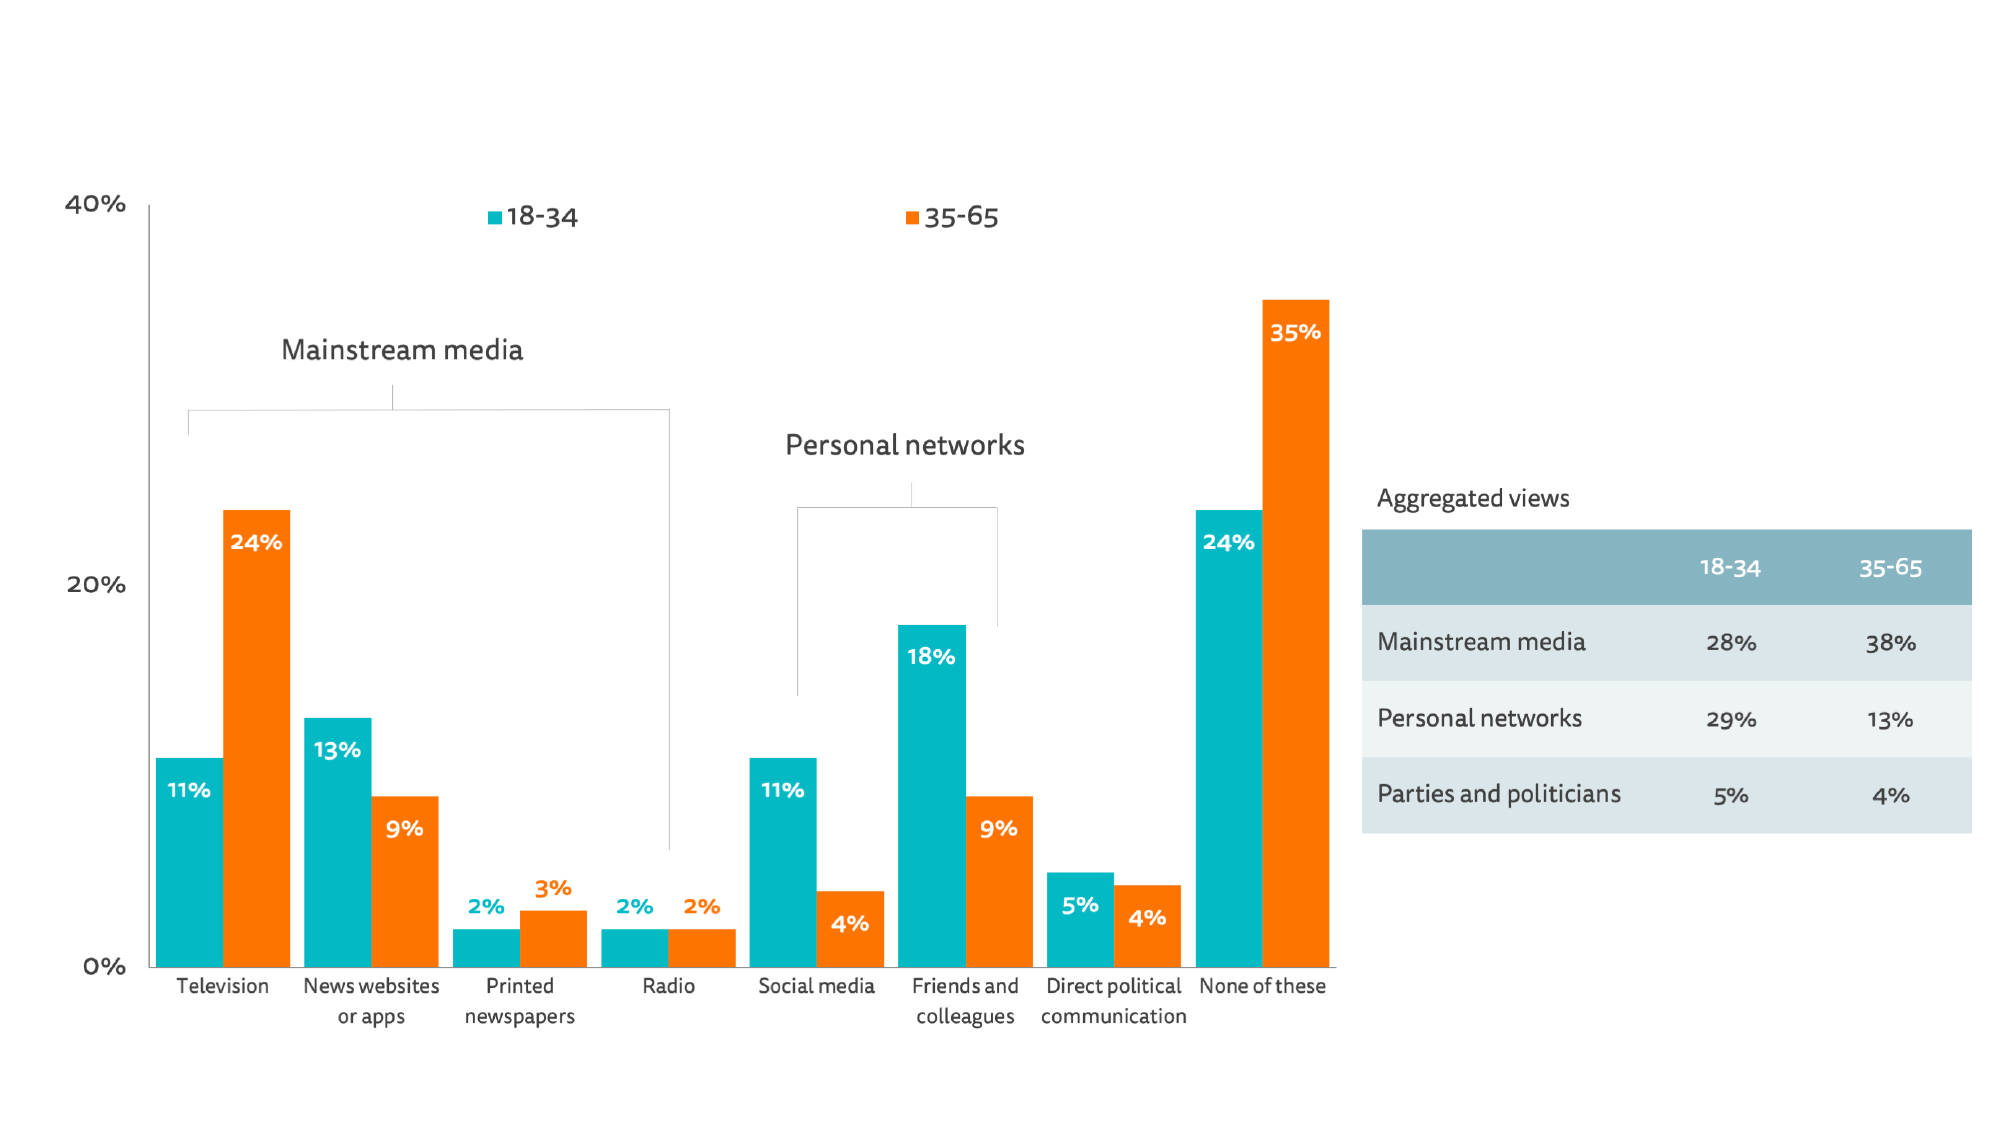 ELECTIONUNDERSTAND. Which of the following, if any, was most important for helping you decide who to vote for in the election? Base: Total survey sample = 752.
TV Debates and their Impact
In recent times, some of the most eagerly awaited moments of a UK election campaign have been the TV debates between party leaders. These debates, which are hosted by the main broadcasters, attract a considerable amount of journalistic attention, be it on social media or within media commentary. The first debates in 2010 had significant impact on the course of the campaign, if not on the result itself, and since then many politicians have been understandably wary of the format and the risks that it entails.
But how influential were the debates this time round? We asked our participants whether they had seen any of the televised encounters between the two main party leaders Boris Johnson and Jeremy Corbyn and whether they believed that the debates helped them in understanding the issues of the election and in making a vote choice.
Our survey data show that the majority of our respondents had not seen any of the debates. Only 38% of those surveyed said they had followed one or more of them. Not too surprisingly, most watched the debates on television, with about a fifth having seen the debates online; 17% saw the debates on social media and just 10% heard about them via the radio.
Amongst those who followed at least one of the debates, the coverage seems to have had some impact. A third (34%) said they had been important or very important in helping decide whom to vote for, with another 40% saying it had been slightly or moderately important (Fig. 35). The importance of the debates was seen to be even higher in helping to understand the key issues at stake in this election, with more than four in ten saying they were important or very important.
Figure 35. Importance of the General Election debates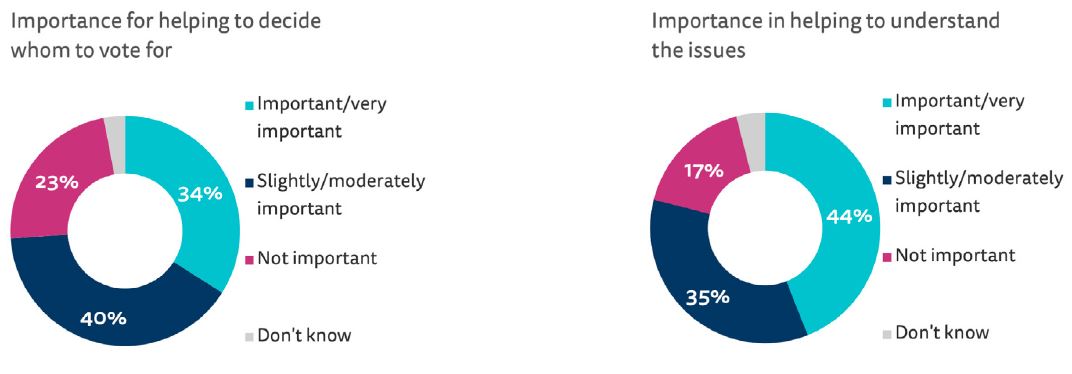 DEBATES_UNDERSTAND. How important, if at all, were the debates for helping you decide who to vote for in the election? DEBATES_CLARIFY. How important, if at all, were the debates in helping you to understand the issues during the election? Base: All survey respondents that watched part of the debates = 289.
It is clear that television debates – as well as television news and current affairs – remain a significant source of election news in terms of both consumption and impact, especially for older groups. But this chapter has also illustrated striking generational differences which over time will further reduce the impact of traditional formats. Younger groups are already getting much of their election news online or via social media and this is affecting the political information they are exposed to during campaigns.
Conclusion
Despite the importance to the Brexit outcome, it is clear that the British people were not fully engaged by an election just a few weeks before Christmas. There was a peak of interest at the beginning of the campaign and another one when the result became clear, but overall the amount of news consumed online was pretty similar to a non-election period and interest fell over the course of the campaign. Individual news organisations with highly engaged and politically interested users may have seen more activity, but we find no evidence of an overall increase.
Frustration with the drawn-out Brexit process may have played a part in this – along with lack of trust in politicians. With many people saying they worry that they can’t tell the difference between what is real and fake online it is perhaps not surprising that many turn as much to their friends or colleagues to help make up their mind as they do to the media these days.
But even if the news media play a smaller role than in the past, our report does show that the vast majority of our sample consistently consumed the reporting of a relatively small number of mainstream news brands operating across a combination of TV, radio, print, and online. Television remains an important source of news overall as well as helping people understand the issues.
But TV is unlikely to maintain this level of importance in the years ahead as the population ages and fewer people watch traditional TV news. If these trends continue it is not clear which media will fill the gap or how fair and balanced that will be. News media did reach over 70% across online sources but much of this was shallow and fragmented – accounting in total for just a fraction of all internet time.
The evidence that younger voters spent just 8 minutes per week with online news media (and even less with election news) and that more than one in ten (13%) of this group only used social media for election news will be of considerable concern for those who worry about political engagement and the health of democracy. This is not so much a concern about political filter bubbles, since our data suggest social media users tend to be exposed to a wider range of political news, but more a worry about why younger people seem to find existing news media so unappealing , and about the unreliability and the lack of transparency over what people are exposed to.
In terms of news brands, the presence of the BBC is both unsettling and reassuring. Its political coverage dominates online news coverage as much as it does via TV and radio, suggesting a less plural media than some might like. On the other hand, it could be seen as a positive that most of the news people were exposed to came from an organisation that has particular obligations to be fair and balanced during an election, conducted regular fact-checking of politicians, and published a wide range of information about party positions. Given the importance of this output, it is scarcely surprising that the BBC’s coverage has come under such scrutiny from both sides and was the subject of more complaints than ever before.
Despite this, our data suggest these criticisms from political parties, activists, and media commentators were not fully shared by ordinary people. The majority of those who expressed a view felt the BBC had done a good job. BBC stories were widely viewed, and read equally by Conservative and Labour voters. More widely, however, it is true that Labour supporters feel more suspicious of the media than Conservatives. There is historic resentment on the left about the relentless personal attacks by right-wing titles which they believe make it harder for a Labour leader to ever win an election. But it is also clear from our data that the right-wing media – with the exception of the Daily Mail – have lost influence and reach with the move to online and continue to do so with each passing election. Indeed, there are more left-leaning options online and some of these, like the Guardian, have gained much greater reach and influence than they ever had in print.
It was probably never the case that headlines in a national newspaper endorsing one party or another could win or lose an election. That is even less the case today as politicians develop their own channels and as personal networks have become more important in influencing choices. This report shows that mainstream media still play an important role in scrutinising politicians and helping to inform voters, but they no longer have a monopoly on these activities.
Before the election, much of the public debate in media circles related to concerns about political polarisation fuelled by online and social media, but our analysis suggests an even bigger problem may be the lack of significant engagement with news by significant portions of the population.
News media looking to increase their relevance may wish to draw the lessons from this campaign to convince those disappointed with the coverage that they can do a better job in the months and years to come.
Methodology
This study was commissioned by the Reuters Institute for the Study of Journalism to understand how news was consumed during the 2019 UK General Election campaign. The data were collected by Netquest using a combination of passive tracking and two online questionnaires.
Netquest tracked the computer and mobile use of 1,711 people aged 18 to 65 from 4 November to 15 December 2019. A subset of these panellists was also invited to complete an online survey shortly after the official start of the election campaign (fieldwork 13–19 November), and again immediately after polling day (fieldwork 13–19 December): 840 panellists completed the first survey, and 752 of these also completed the second survey (retention rate: 90%).
For most of the statistics we present here, the base is everyone in the panel that accessed a website at least once during the campaign from either a computer or mobile device (1,666 people). Where we refer to the use of apps, the base is everyone that accessed the internet using an app during the campaign (758).
The tracking data were weighted to be representative of the British population aged 18 to 65 in terms of age, gender, and region, based on the latest population estimates from the Office for National Statistics.6 The survey data were weighted to be representative of the British population aged 18 to 65 in terms of age and gender. As the focus of the research was on the UK General Election, we excluded panellists from Northern Ireland due to differences in the political system.
The focus of this research is on the passive tracking of online media use. Limitations associated with panel recruitment and the practicalities of the tracking methodology meant that we were not able to recruit a sufficient number of people aged over 65 to make it representative of the entire British population. Therefore, we restricted the study to those aged 18 to 65. This is important to keep in mind here because age is an important predictor of both vote choice and news use. As such, the data will tend to under-represent Conservative voters. This means that our survey sample contained slightly more Labour voters than Conservative voters, but this is consistent with post-election polling from YouGov that also showed that Labour had a higher vote share than the Conservatives among the under-65s.7
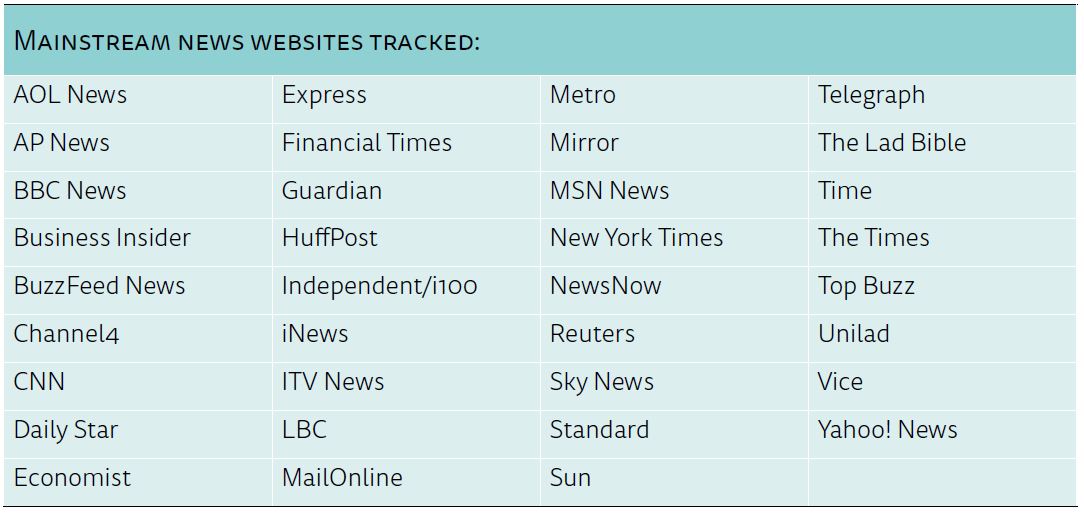
The focus of this study is online news use. We tracked the use of 35 of the most popular mainstream national and international news websites for broadcast, newspaper, and digital-born outlets (e.g. bbc.co.uk/news, dailymail.co.uk, huffpost.co.uk), 879 local newspaper websites (e.g. birminghammail.co.uk, liverpoolecho.co.uk), 20 specialist, alternative, or partisan websites (e.g. thecanary.co, breitbart.com, newstatesman.co.uk), seven satirical news websites (e.g. thepoke.co.uk, thedailymash.co.uk), and 125 dedicated politics pages on Facebook (e.g. Leave.EU, EvolvePolitics). We also tracked the use of 16 dedicated mobile news apps (e.g. BBC News app, Sky News app). Unless otherwise specified we use ‘news’ to refer to the 35 most popular mainstream national and international news outlets.
Passive tracking data are generally considered to be a more reliable way of measuring online news use than surveys. However, the tracking software is only designed to collect data on URLs accessed using computers running Windows and Mac OSX operating systems. The mobile tracking software can be installed on both Apple and Android smartphones and tablets, but only the top-level domain for each URL accessed (e.g. bbc.co.uk, theguardian.com) can be recorded, as well as which apps are shown on the main screen. As the passive tracking software records the URLs loaded by browsers, it is not possible to track what people ‘see’ on their screens but do not click on. As such, passive tracking does not record, for example, news snippets displayed on people’s social media feeds or on apps that use their own in-built browsers. Panellists are able to turn off the tracking software for 15-minute periods at any time, and this is not recorded in the data.
As tracking software only measures online use, we supplemented it with online survey data on people’s attitudes and their offline news use. Online samples will tend to under-represent the consumption habits of people who are not online – typically those who are older, less affluent, and with lower levels of formal education. It is also important to note that online surveys rely on recall, which is often imperfect or subject to biases. We have tried to mitigate these risks through careful questionnaire design and testing. We have made particular use of survey questions from the British Election Study, and we are very grateful to them for making their survey questions publicly available.8
The size of the survey sample means that some subgroups in the data are too small to meaningfully compare to others. For example, it is possible to compare Conservative voters with Labour voters, but not with voters for other parties. Even comparisons between Conservative and Labour voters should be treated with caution because with roughly 200 voters for each in the sample of 752, only differences of around 10pp will be statistically significant using a chi-squared test (p < .05). Where appropriate, we flag differences between groups that we do not believe to be statistically significant using this test in both the text and the figures.
About the Authors
Richard Fletcher is a Senior Research Fellow at the Reuters Institute for the Study of Journalism and leads the Institute’s research team. His primary research interests are global trends in digital news consumption, comparative media research, the use of social media by journalists and news organisations, and more broadly, the relationship between technology and journalism. He is lead researcher and co-author of the main Digital News Report – the world’s largest annual survey of global news consumption.
Nic Newman is Senior Research Associate at the Reuters Institute for the Study of Journalism, where he is lead author of the annual Digital News Report and the annual Journalism Trends and Predictions report. He has recently published a detailed study on news podcasting. Nic is also a consultant on digital media, working actively with news companies on product, audience, and business strategies for digital transition.
Anne Schulz is a postdoctoral Research Fellow at the Reuters Institute for the Study of Journalism. Her doctoral work focused on populism, media perceptions, and news consumption. She is researching questions surrounding news audiences and digital news.
Published by the Reuters Institute for the Study of Journalism with the support of the Google News Initiative.
1. Here we have used the Wikipedia list that details endorsements and assumed that all local papers took a neutral approach except for the Standard and the Liverpool Echo. https://en.wikipedia.org/wiki/Endorsements_in_the_2019_United_Kingdom_general_election
2. https://uk.reuters.com/article/uk-britain-election-labour-bbc/labour-accuses-bbc-of-bias-in-election-coverage-idUKKBN1Y92J1
3. How Young People Consume News and the Implications for Mainstream Media. Report commissioned by the Reuters Institute, authored by Flamingo. https://reutersinstitute.politics.ox.ac.uk/our-research/how-young-people-consume-news-and-implications-mainstream-media
6. https://www.ons.gov.uk/peoplepopulationandcommunity/populationandmigration/populationestimates/bulletins/annualmidyearpopulationestimates/latest