
This year’s data see a quickening of the pace towards social and mobile news, a decline in desktop internet, and significant growth in video news consumption online.
At the same time, we see the continued centrality of traditional platforms – particularly television – and ever more stark country-based and generational divides over the way news is found, consumed, and distributed.
- We see the smartphone more clearly as the defining device for digital news with a disruptive impact on consumption, formats, and business models. Our data suggest it provides an environment dominated by a few successful brands, with others struggling to reach a wider audience, both via apps and browsers.
- The move to online video, new visual formats, and social media coincides in many countries with a fall in audiences for traditional TV bulletins. The trend is most pronounced amongst the under 35s.
- We see a strengthening in the role played by Facebook in finding, discussing and sharing news. Facebook-owned Instagram and WhatsApp are playing a big role amongst younger groups.
- The increasing importance of search and social as gateways to news has raised concerns over online ‘filter bubbles’, but our respondents say these services help them find more diverse news and lead them to click on brands they do not normally use.
- We see an intensifying battle for global audiences online involving new players like the Huffington Post and Buzzfeed, expanding global newspapers like the Guardian and New York Times and old stalwarts including the BBC and CNN.
- Finally we find significant consumer dissatisfaction with online advertising, expressed through the rapid take up of ad blockers and disquiet over the blurring lines between editorial and advertising.
Mobile growth
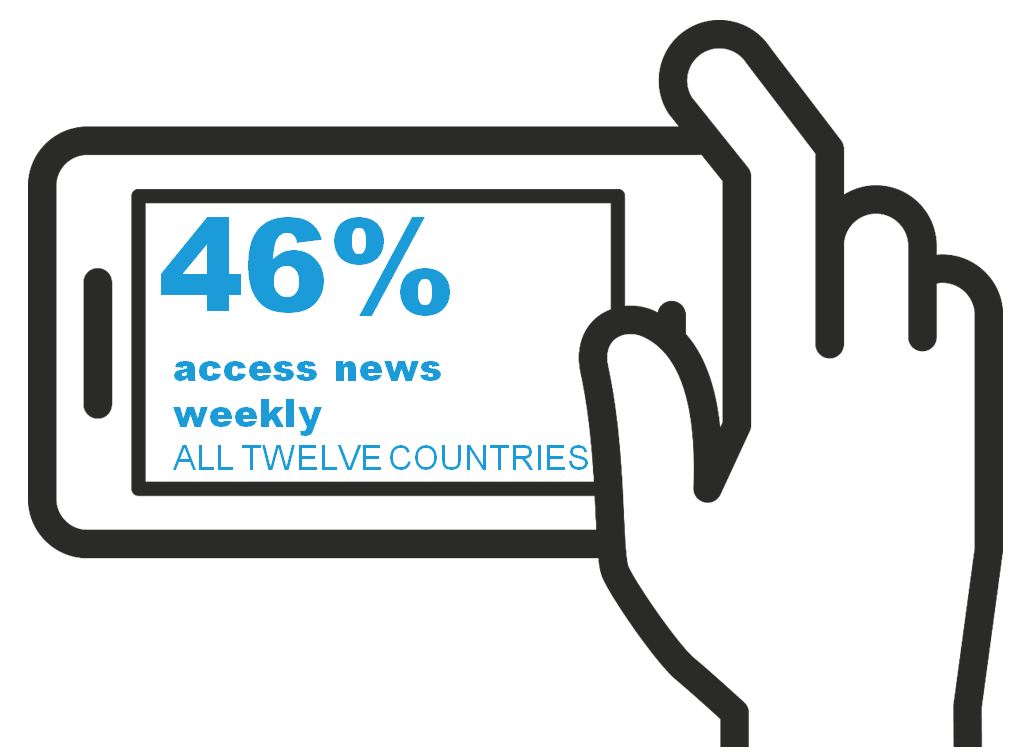
News accessed from smartphones has jumped significantly over the last 12 months, particularly in the UK, US, and Japan. Average weekly usage has grown from 37 to 46% across all our countries. Two-thirds of smartphone users (66%) are now using the devices for news every week.
Smartphone news use 2012–2015
Base: Total sample in each country 2012–15
Scroll data area to see more
| Also from 2015 | |
|---|---|
| Australia | 59% |
| Ireland | 52% |
| Finland | 50% |
| Spain | 48% |
| Italy | 44% |
Surprisingly given the amount of time spent in apps generally, people in most countries say they are likely to access news via a mobile browser. This suggests that news may not always be a primary destination but will often be found through links from social media or email. Only the UK bucks the trend, with the mobile app preferred (46%) over the browser (40%) and 10% saying they use them about the same
On average people use a small number of trusted news sources on the mobile phone. The average across all countries is 1.52 per person, significantly fewer than on a tablet or computer. We also find that, even though 70% of smartphone users have a news app installed on their phone, only a third of respondents actually use them in a given week, reinforcing the difficulty many news brands have in cutting through on this crowded and very personal device.
In the UK, over half of smartphone news users (51%) regularly use the BBC News app, the only country where we see this level of reach.
Top news apps – selected countries
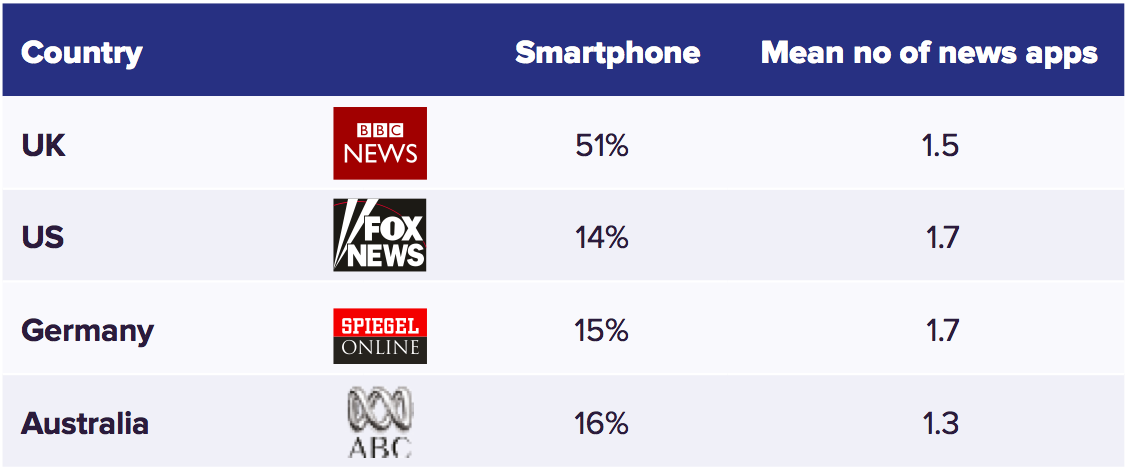
Base: All who accessed news on a smartphone in the last week UK=807, US=910, Germany=617, Australia=1067
In many countries these trends mean that for many publishers the majority of traffic comes from new mobile devices. In launching its new responsive design site in early 2015, the BBC revealed1 that 65% of traffic is now generated by smartphones and tablets.
Across all our countries a quarter of our sample (25%) now say the smartphone is their MAIN device for accessing digital news – up from 20% last year. That figure rises to two-fifths (41%) of those aged under 35.
Tablets’ growth slowing, computers’ importance on the slide
In contrast we find tablet growth for news weakening in most countries (with the exception of the UK). Bigger smartphone screens, along with growing penetration, look to be reducing the need for a separate, less portable touch screen device in the home.
Tablet news use 2012–2015
Base: Total sample in each country 2012–15
Scroll data area to see more
| Also from 2015 | |
|---|---|
| Australia | 35% |
| Ireland | 22% |
| Finland | 26% |
| Spain | 24% |
| Italy | 19% |
| Brazil | 19% |
The role of the laptop and desktop computer is also changing. Only just over half (57%) now consider it their most important device for accessing online news – down eight percentage points from last year. The computer remains the most important device in the office, but at home in communal and personal spaces it is being squeezed by the adoption of tablets and smartphones.
But the key trend is not around replacement of one device with another; rather it is that far more people are using two or three devices to access the news.
In the US, 41% (+6) use two or more devices to access news on a weekly basis. In the UK, the figure is 44% (+9), 59% in Denmark, and 58% in Australia.
Smartphones and tablets are extending our access points making us more connected to the news at home and on the move.
The enduring strength of TV, decline of print, and the rapid rise of social media
We now have four years of data looking at the sources people use for news. In most countries we see a consistent pattern, with television news and online news the most frequently accessed, while printed newspapers have declined significantly and social media are growing rapidly.
Sources of news 2012–15: TV, online, print, and social media – USA
Base: All 2012–2015 – UK: 2076/2078/2082/2149; USA: 845/2028/2197/2295. NB: 2014 data have been estimated because of an issue with randomisation of news sources in the questionnaire.
Sources of news 2012–15: TV, online, print, and social media – UK
Base: All 2012–2015 – UK: 2076/2078/2082/2149; USA: 845/2028/2197/2295. NB: 2014 data have been estimated because of an issue with randomisation of news sources in the questionnaire.
This online survey is likely to underestimate the true levels of access to television news but even so we can detect in the US and UK some fall-off in topline figures – specifically in the number of people watching scheduled TV bulletins and programmes. This is particularly the case with the young where in the United States less than a third (31%) of under 45s now watch a scheduled TV bulletin compared with 42% two years ago. It is a similar story in the UK – 46% down from 56% in 2013.
Weekly news access to TV programmes and bulletins – US
Base: Total sample 2013/2015 – UK: 2078/2149; USA: 2028/2295
Weekly news access to TV programmes and bulletins – UK
Base: Total sample 2013/2015 – UK: 2078/2149; USA: 2028/2295
But the picture is not the same in all countries. TV viewing in Germany has hardly been affected; indeed it remains strong even with the young – 58% of under-35s still watch a scheduled programme or bulletin – while social media growth is less pronounced. In Denmark we don’t see online’s strength significantly affecting TV, though print is down, online is up, and social media have become a major part of the equation.
Sources of news 2012–15: TV, online, print, and social media – Germany
Base: Total sample 2012–2015 – Germany: 970/1062/2063/1969; Denmark 1002/1007/2036/2019. NB: 2014 data have been estimated because of an issue with randomisation of news sources in the questionnaire.
Sources of news 2012–15: TV, online, print, and social media – Denmark
Base: Total sample 2012–2015 – Germany: 970/1062/2063/1969; Denmark 1002/1007/2036/2019. NB: 2014 data have been estimated because of an issue with randomisation of news sources in the questionnaire.
Weekly access is only one part of the picture. We also track the value of different news sources and again we see that TV news comes out even more strongly as the most important source of news in the majority of countries – with the exception of the US and Finland where online is ahead. Social media are now considered more important than print in the US, Ireland, Brazil, Italy, France, Spain, and Australia
Main source of news – by country
Base: All who used a source of news in the last week in each country.
France, Germany, and Japan have the strongest allegiance to traditional media and they have been slower to adopt new digital trends such as smartphones and social media. But these averages hide even more stark splits between generations. Young Germans or Japanese are likely to have more in common with young Americans or Finns – in preferring online news and social media to TV news, radio, or print.
Main source of news – by age
Base: All who have used a source of news in the last week All = 23155.
We have also broken down – for the first time this year– the concept of value into a number of dimensions, including speed, serendipity, and accuracy. Once again TV comes out strongest for accuracy, even if you take into account the fact that it is the most widely used news medium in most countries.
Best source for accuracy – selected countries
Base: All who used a source of news in the last week in each country UK = 2105, US = 2198, France = 1947, Germany = 1943, Spain = 1904, Ireland = 1486.
Even social media users value TV most for accuracy and reliability – and by some margin. Only 12% of these say social media is best for accuracy, compared with 37% for TV.
Social media are not seen as a destination for accurate and reliable journalism but more as a way of getting access to it.
Trust in the news
The link between strong TV news consumption and trust is also to be found in a general question we ask about how much you trust the sources of news available. We compare this with trust in the specific sources you use.
Overall we find significant differences in general trust, with over two-thirds (68%) agreeing that they trusted the media in Finland, compared with only one-third in the United States (32%), Spain (34%), and Italy (35%). Many of the countries with the highest levels of trust also have well-funded public service broadcasters.
Trust in the news – all countries
Scroll data area to see more
| FIN | BRA | GER | DEN | UK | JAP | IRE | AUS | FRA | ITA | SPA | USA | |
|---|---|---|---|---|---|---|---|---|---|---|---|---|
| Trust in general | 68% | 62% | 60% | 57% | 51% | 46% | 46% | 39% | 38% | 35% | 34% | 32% |
| Trust in my sources | 73% | 70% | 68% | 65% | 64% | 50% | 57% | 53% | 49% | 48% | 46% | 56% |
Q6b. ‘I think I can trust most of the news that I use most of the time’.
Base: Total sample in each country.
There is a strong link between overall trust and last year’s data about the value placed on sources that tried to be impartial (neutral) in how the news was covered.
The role of social networks
Over the past year there has been a new focus on the role of Facebook in distribution of online news. Publishers have reported greater traffic from Facebook following changes to its algorithms and the introduction of autoplay for short videos. Our data show that Facebook is becoming increasingly dominant, with 41% (+6) using the network to find, read, watch, share, or comment on the news each week – more than twice the usage of its nearest rival.
The strong growth of both WhatsApp and Instagram – which are both popular with the young – has strengthened Facebook’s hold on social discovery in the last year.
Top social networks for news (and for any purpose)
Base: All = 23557.
These averages mask significant differences between genders, ages, and countries in terms of the networks used. 18–24s continue to use Facebook and Twitter but have also adopted other networks and messaging apps for more private conversations, sharing pictures, and a different tone. Snapchat2 and Instagram are actively courting publishers and offering opportunities to push and monetise content notably with the launch of Snapchat Discover. News publishers are also setting up branded accounts on these new networks as a way of reaching younger audiences.
Outside the United States
Elsewhere we see a different mix of secondary networks. Line is popular in Japan; Viber has significant reach in Ireland and Australia; Finland has a popular chat network Suomi24, while France is the home of Daily Motion a popular video network that was widely used during the Charlie Hebdo attacks.
WhatsApp is proving time-consuming for publishers to set up lists and deliver bulk messages
WhatsApp is hardly used in the United States but is a growing force elsewhere. It played a major part in last year’s Brazilian elections and is also used for traffic updates. Many brands now offer WhatsApp sharing buttons on their websites but it remains a commercial-free zone and the network makes it notoriously difficult to push messages to multiple users.3
Top countries for WhatsApp
Scroll data area to see more
| Use for all | Use for news | |
|---|---|---|
| Spain | 67% | 27% (+1) |
| Brazil | 61% | 34% (+19) |
| Italy | 49% | 18% (+5) |
| Germany | 41% | 9% (+3) |
| Finland | 32% | 4% |
| Australia | 25% | 7% |
Base: Total sample Germany = 1969, Finland = 1509, Italy = 2006, Spain = 2026, Brazil = 2033, Australia = 2042.
Other home-grown networks like Tuenti in Spain and Mixi in Japan have been losing ground over the last few years in the face of growing competition. Google closed its Orkut service in Brazil last year, effectively conceding the battle to Facebook in one of the world’s most active markets. Only in Japan is Facebook NOT the largest network for news. The next chart shows strong growth in Facebook over the past year in a number of countries including France, UK, and Denmark. Germany and Japan have bucked the trend partly because of a reluctance in those countries to use real names while posting in social networks.
Facebook use for news 2014-15 – selected countries
| UK | US | France | Denmark | Germany | Japan | |
|---|---|---|---|---|---|---|
| 2014 | 22% | 37% | 27% | 31% | 26% | 12% |
| 2015 | 29% | 40% | 35% | 44% | 23% | 11% |
| Change | +7 | +3 | +8 | +13 | -3 | -1 |
Base: Total sample UK = 2149, US = 2295, France = 1991, Germany = 1969, Denmark = 2019, Japan = 2017.
As Facebook – and YouTube and Twitter – talk to publishers about hosting more content on their platforms, there is renewed concern about the power of these networks, about the lack of transparency around the algorithms that surface content and about the extent to which publishers will get a fair return for the quality content that drives so much social media usage. These issues are tackled in an important essay from Emily Bell Director of the Tow Center for Digital Journalism at Colombia University.
We seek news on Twitter but bump into it on Facebook
Facebook and Twitter remain the most important networks for news in terms of referrals and engagement. But our survey throws up important differences between the two. In Facebook – which has a very general audience and wide remit – the pursuit of news is secondary, with the main aim being communicating with friends. Twitter, on the other hand, is seen much more as an active destination for news by an audience that is deeply interested in latest developments.
Relative importance of news: Twitter and Facebook compared
Base: All those in UK, US, Italy, Australia, who used Twitter/Facebook for news in the last week. All = 861/3560.
Our report this year also casts further light on the role of social media in political news and discourse.
- Around a fifth of social media users follow a politician or political party in Australia (17%), Italy (20%) and the UK (23%) with more than a quarter (28%) doing so in the United States.
Growth in online news video
There has been a significant increase in the consumption of online news video, notably in Spain (+10), Denmark (+8), UK (+5), Italy (+5), and Japan (+5). This reflects the new strategies from social networks to display and play more video and a greater supply of video from publishers. News organisations have set up or expanded teams over the last year to create – or repackage video – partly because advertising premiums are far higher than for text news and partly to take advantage of new distribution opportunities.
More of us are using video but others remain to be convinced. In seven countries4 we asked those who said they didn’t use video about the reasons. Four in ten (40%) say they find reading text more convenient, almost a third (29%) are put off by preroll ads, and a fifth (21%) say they’d rather watch on a bigger screen.
Of those who are using news video the most popular format is short-recorded clips that add drama to a news event (49%) or add context or analysis to a text story (46%).
The growth of video is part of a wider adoption of new visual online formats, many of which are also well suited to mobile and social media. Examples include infographics, pictures with text, as well as a range of short-form video formats. Publishers are creating more of this content and more is being consumed.
Gateways to news
Although audiences still consume the majority of their online news from familiar and trusted brands, the way they access that content is changing. The starting point to a news journey is less likely to be a brand homepage and increasingly likely to be via a search engine, a social network, email, or the lockscreen of a smartphone.
We see significantly fewer people accessing the front page of a news website where a list of stories is displayed. More people are going directly to stories via a side door such as search or social media.
Types of news content accessed weekly
Base: All.
Our data show very different patterns of access across countries. In countries like the UK, Denmark, and Finland, branded websites are often the starting point for any news journey. By contrast, in Italy, Spain, Germany, or France, a search engine is often the key gateway while social media are important in Australia and Urban Brazil. Email and mobile notifications are also an important part of the picture.
Starting points for news – all countries
Scroll data area to see more
| UK | US | France | Germany | Ireland | Denmark | Finland | Italy | Spain | Japan | Urban Brazil | Australia | |
|---|---|---|---|---|---|---|---|---|---|---|---|---|
| Direct to news brand | 52% | 36% | 27% | 26% | 44% | 54% | 63% | 20% | 36% | 15% | 46% | 33% |
| Search | 32% | 40% | 40% | 45% | 46% | 29% | 26% | 66% | 54% | 54% | 52% | 49% |
| Social Media | 28% | 35% | 21% | 20% | 36% | 38% | 28% | 33% | 35% | 14% | 48% | 41% |
| 10% | 25% | 21% | 15% | 9% | 24% | 9% | 17% | 14% | 15% | 23% | 20% | |
| Mobile notifications and alerts | 10% | 13% | 14% | 9% | 9% | 9% | 7% | 7% | 8% | 7% | 11% | 9% |
Base: Total sample in each country.
The strength of search in countries like Spain, Brazil, and Germany in part explains why there has been so much heat there over the relationship with Google – and so little fuss in the UK or Denmark. In Spain, Google News was closed in November 2014 after a law was passed that would have forced payment for the use of news snippets – though some news results are still available. A similar law in Germany led to links being dropped by Google for a time until a number of publishers decided to opt back in.
Meanwhile social media traffic has grown significantly in the past year and for some publishers has become more important than search.
Search and social media drive greater diversity
The growth of search and social media as gateways to news has also raised concerns over the potential for online ‘filter bubbles’, but our research suggests that they may help audiences find more diverse forms of news. Three-quarters of social media users (76%) and search users (73%) said they sometimes or frequently accessed different sources – leading them to brands they would not otherwise use.
We also find that the strength of a particular brand in social media is often a critical factor in the choice of which link to choose. A trusted brand (37%) is a key factor likely to influence the choice in a social network, whereas the relevance of the headline is by far the most important factor in search results.
The other key point about social news discovery is that it reaches different demographics – including women and younger groups in general. Those who visit news sites regularly, sign up for email, or receive mobile notifications are heavily male skewed. Search is more even but social is the only discovery mechanism that appeals more to female users.
How social media helps attract female users
| Social | Search | Brand | Notifications | ||
|---|---|---|---|---|---|
| Male | 27% | 46% | 41% | 19% | 11% |
| Female | 36% | 44% | 33% | 16% | 8% |
Base: Male/Female All = 11339/12218.
Mobile notifications
In the past year we’ve seen a significant jump in the usage of mobile alerts and notifications in a number of countries led by France, the US, and UK (see chart). These mechanisms are becoming a key way of reminding consumers of the relevance of a news brand in an increasingly competitive news market.
Growth of mobile notifications – selected markets
Base: Total sample 2014/15 UK = 2082/2149, US = 2197/2295, Denmark = 2036/2019, France = 1946/1991.
With the launch of the Apple Watch, the importance of notifications is likely to grow further as the battle for our attention reaches our wrists.
Social media, email, and mobile notifications are now becoming key retention and distribution strategies for media companies. As such they feed advertising business models driven by page views but also bring new users in for subscription businesses.
The key challenge is to coordinate those strategies better so that individual consumers are not bombarded with irrelevant messages and that publishers use data more effectively to deliver more relevant content at the right time and on the right platform. For all these reasons news organisations are increasingly setting up audience engagement teams to seed content, optimise headlines, pictures, and links across a growing number of platforms.
The battle for global audiences
The internet has removed the barriers around distribution of news and this has led over the years to several attempts to create a news formula that can repeated profitably across the world. Yahoo and MSN built successful businesses around email and web news portals, but now these are losing ground to a new wave of digital-born companies based on social and mobile news approaches. Yahoo News, for example, has lost almost a third of its US reach in the last two years.
By contrast, the Huffington Post is one of the most accessed sites in the United States and now also operates in 14 countries around the world. Buzzfeed has doubled its reach in the US and UK over the last year and has established a strong foothold in a number of countries amongst the young. Vice is also making its mark with online video content that speaks to a younger generation.
If we weight the data by population we find that across our countries Yahoo is in the lead, but this is mainly due to its strong position in Japan – where in reality the American company only has a relatively small stake.
Top global brands – digital born
Scroll data area to see more
| Huff Post | Buzzfeed | Vice | MSN | Yahoo | |
|---|---|---|---|---|---|
| US | 22% | 10% | 3% | 11% | 23% |
| UK | 12% | 5% | 1% | 5% | 8% |
| France | 8%* | 1% | 1% | 7% | 8% |
| Germany | 6%* | 1% | 1% | 4% | 5% |
| Spain | 8%* | 1% | 1% | 9% | 8% |
| Italy | 7%* | 1% | 1% | 8% | 11% |
| Ireland | 8% | 6% | 1% | 5% | 9% |
| Brazil | 2%* | 2% | 1% | 20% | 18% |
| Australia | 12% | 7% | 1% | 25%* | 21%* |
| Japan | 2%* | 1% | – | 10% | 52%* |
| Weighted** | 10% | 4% | 1% | 8% | 18% |
Base: Total sample in each country.
* Represent joint ventures and some cases (e.g. Australia’s NineMSN) where MSN retains the name but has sold the business.
** Note: Weighted percentage calculated using population data from Internet World Stats and the World Bank: weighted = (country population * percentage adults * percentage accessed)/total population of all countries surveyed. Brazil is not included due to the absence of reliable data about its urban population.
Meanwhile the Daily Mail, the Guardian, the New York Times, the BBC, and CNN are engaged in a battle for English-speaking audiences in the US, UK, Australia, and elsewhere. The BBC and CNN remain strong globally – not least when you take into account their enormous reach via TV and radio.
Top global brands – traditional
Scroll data area to see more
| D Mail | Guardian | NY Times | BBC | CNN | |
|---|---|---|---|---|---|
| US | 3% | 4% | 12% | 10% | 14% |
| UK | 14% | 12% | 1% | 48% | 1% |
| France | – | – | 1% | 3% | 2% |
| Germany | – | – | 1% | 3% | 3% |
| Spain | – | – | 3% | 5% | 4% |
| Italy | – | – | 2% | 3% | 4% |
| Ireland | 7% | 4% | 4% | 17% | 5% |
| Brazil | – | – | 6% | 8% | 9% |
| Australia | 3% | 7% | 4% | 14% | 7% |
| Japan | – | – | 2% | 3% | 5% |
| Weighted* | 2% | 2% | 5% | 8% | 6% |
In domestic online markets we see a continuation of the trend that sees new ‘digital born’ brands disrupting the dominance of traditional news organisations – especially in Japan, Australia, Brazil, and the US (see the next chart).
In other countries like Denmark, Finland, and the UK, strong newspaper brands and strong public service broadcasters have captured most of the online market, leaving little room for new players.
Disruption by digital born players – all countries
Base: Total sample in each country.
Australia’s position is mainly because of popularity of the Yahoo7 and NineMSN, while Japan’s disruption relates chiefly to Yahoo Japan, which has 52% weekly reach with our sample. Brazil has a range of home-grown portals and aggregators as well as strong traditional media companies, while the disruption in the United States is the most diverse from mature start-ups like Huffington Post (now owned by AOL) to vibrant new start-ups like NowThis and Vox.
The business of journalism
Sales of printed newspapers have continued to fall in most countries but those with strong home delivery like Japan have been able to weather the storm a little better (see next chart).
Sales of printed newspapers – selected markets
Base: Total sample 2013–15 UK = 2078/2082/2149, US = 2170/2197/2295, Germany = 1099/2063/1969, Denmark = 1024/2036/2019, Japan = 1004/1973/2017.
Sales of printed newspapers – how purchased
Base: Total sample 2013–15 UK = 2078/2082/2149, US = 2170/2197/2295, Germany = 1099/2063/1969, Denmark = 1024/2036/2019, Japan = 1004/1973/2017.
Meanwhile in our survey we see no discernible trend towards an increase in paid online content – or in willingness to pay. A small number of loyal readers have been persuaded to pay for brands they like but it is proving hard to convert casual readers when there is so much free news available from both commercial media companies and public service media.
Payment for online news by country
| UK | Ireland | Germany | France | Japan | USA | Spain | Australia | Italy | Denmark | Finland | |
|---|---|---|---|---|---|---|---|---|---|---|---|
| Paying for news | 6% | 7% | 7% | 10% | 10% | 11% | 11% | 11% | 12% | 13% | 14% |
Base: Total sample in each country.
These headline numbers do, however, conceal some significant shifts – and a rise in overall revenue.
In the UK, four years ago the majority of payment was small-scale and one-off. Today, almost three-quarters of the total (71%) is for an ongoing subscription (digital only, digital/print, or other combination) meaning that average yearly spend has risen to around £10 a month. This is twice the spend on online news in Spain (€5) where there is a higher level of one-off payment.
Average spending on online news – selected countries
Scroll data area to see more
| UK | US | Australia | Spain | |
|---|---|---|---|---|
| Average monthly spend | £10 | $10 | $10 | €5 |
| Ongoing payment | 71% | 67% | 70% | 49% |
Base: All who paid to access online news in the past year, and all who specified what types of payment they made (excluding those who did not know) UK = 87, US = 199, Australia = 177, Spain = 181.
A key focus for the industry over the past year has been to try to get more people – especially younger people – subscribing to content but there has been limited success.
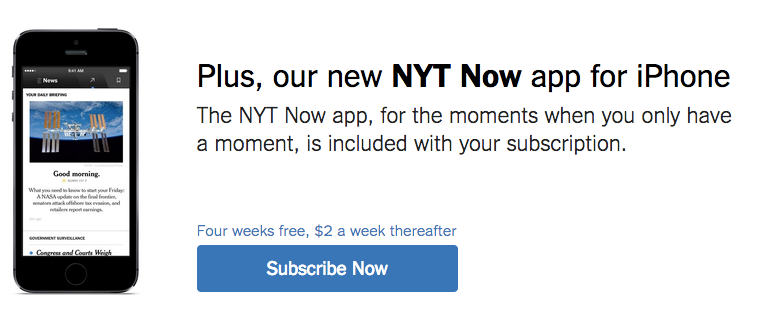
The New York Times launched a number of spin-off paid apps, including NYT Now and Opinion in April 2014, but the Opinion app was shelved and the NYT Now one did not attract the numbers or demographics initially hoped for and will become a free service.5
Specific questions we asked in four markets shows that very few of those not already paying would be prepared to pay anything for online news. The rest would pay only a small amount.
Future likelihood to pay – selected countries
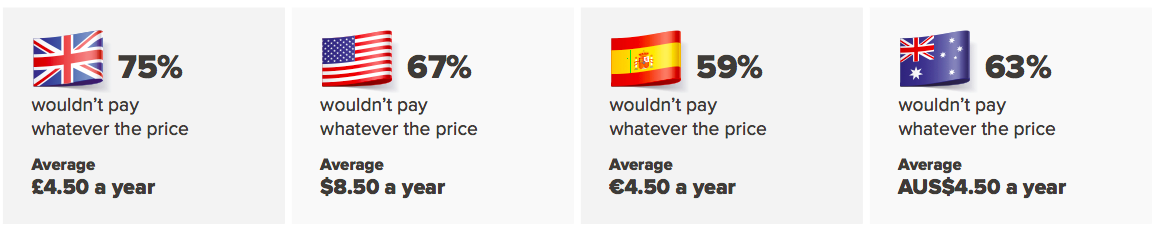
Base: All who had not paid for news in the last year UK = 1992, US = 1942, Spain = 1773, Australia = 1805.
Ad-blocking, native advertising, and sponsored content
If the move to paid content remains difficult, online advertising – banner advertising in particular – is going through something of an existential crisis. Revenue from display ads has continued to fall, accidental clicks are up with the move to mobile (fat fingers), and there is industry concern about fraud and a lack of transparency.
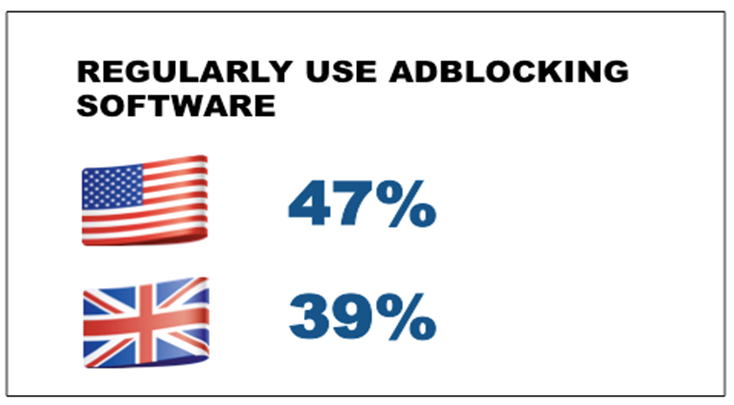
Our research shows that consumers are voting with their feet as they get bombarded with more and more intrusive advertising online. 47% of our US sample and 39% in the UK don’t see always see ads because they use ad-blocking software to screen them out. More generally, a third or more (39% in the UK and 30% in the US) say they ignore ads. Around three in ten (31/29%) say they actively avoid sites where ads interfere with the content.
Against this background, it is not surprising that many publishers are abandoning the old models in favour of new ‘native’ advertising or sponsored content. Buzzfeed, Vox, and Vice are leading the charge, with the New York Times, Washington Post, and Guardian amongst traditional news organisations setting up creative teams to work on editorial content with brands. It is a complex area with many different variants of native advertising emerging. There are few standards on labelling or common agreement on best practice. The area is particularly controversial in the industry because it tends to blur the line between editorial and advertising.
This year we have conducted qualitative and quantitative research into consumer attitudes towards sponsored content and native advertising in both the UK and US. The main headlines are:
- A third or more say they have felt disappointed or deceived after reading an article they later found had been sponsored.
- Half say they don’t like sponsored content but accept this is part of how they get free news.
- Over a quarter feel less positively about the news brand as a result of sponsored content or native advertising.
Conclusions
This year’s survey underlines both the pace of change but also the increasing complexity of our media ecosystem. New global brands are emerging, there are new platforms for distributing and monetising the news, new devices for accessing it, and new formats to tell stories.
All of this is part of fundamental shift away from the broadcast models of the past to ones where it is possible to deliver more relevant, more personal, more interactive news at any time and in any place.
And yet while our data suggest that this is becoming a reality for some, there are still many who continue to value traditional approaches. Most people still get their news from a combination of TV, radio, print, and online. Traditional news brands continue to dominate online in almost all the countries we studied, even if intermediaries are becoming far more important as a way of getting to those brands. It is also worth noting that even amongst our online sample about two in ten do not use internet news regularly (relying instead on broadcast and print). About one in three smartphone users do not use their phone for news, and around one in three Facebook users do not see social media as a source of news.
The reality is that most people over 45 are using digital news as an additional layer of choice and convenience without abandoning their core habits around television, radio, and print. Younger audiences who’ve grown up with digital are exhibiting very different behaviours and increasingly expect the news to come to them through online channels and in new formats.
The challenge for traditional media brands is how to manage this growing divergence in behaviour, along with the intense business pressures being thrown up by the second wave of disruption from mobile and social.
Print revenues are declining fast while only a minority is prepared to pay for news online. Mobile advertising is generating less than via desktop, video advertising is promising but nascent, while sponsorship and native options are throwing up new questions around trust and journalistic integrity.
Meanwhile Facebook and Google continue to build some of the world’s most profitable companies based on targeted advertising wrapped around relevant and interesting content.
Against this backdrop, news companies face another year of intense pressure and will have to be more inventive than ever with editorial and business strategies if they are to survive.
- http://www.bbc.co.uk/news/technology-31966686 ↩
- http://techcrunch.com/2015/03/02/new-data-shows-mobile-data-consumption-skyrocketing-following-snapchat-discovers-launch ↩
- http://digiday.com/publishers/publishers-whatsapp-alerts-easier-said-done ↩
- UK, US, France, Germany, Italy, Finland, and Ireland. ↩
- http://www.bloomberg.com/news/articles/2015-04-15/nyt-makes-now-app-free-scrapping-monthly-fee-to-attract-readers ↩