 Subhayan MukerjeeResearch Fellow, University Of Pennsylvania
 Taberez Ahmed NeyaziAssistant Professor Of New Media And Political Communication, National University Of Singapore
  Rasmus Kleis NielsenDirector of Research, Reuters Institute for the Study of Journalism
June 2019
Introduction
In this RISJ Factsheet, we study online audience engagement with legacy and digital-born news media across social media platforms (Facebook and Twitter) and the open web during the 2019 Indian General Election on the basis of data collected between 11 April and 19 May.1 We analyse cross-platform online audience engagement with a sample of 101 major Indian news media during an election in which more than five thousand candidates ran for the 543 available seats in the Lok Sabha, the lower house of the Indian parliament, and nine hundred million eligible voters were called to the polls in the largest democratic election in the world.
Using the Indian General Election as our case study, the purpose of the factsheet is twofold. First, we analyse patterns of news audience behaviour across social media platforms and compare these to the open web. Second, we examine the relative performance of (and competition between) legacy news media like newspapers and broadcasters, and newer digital-born news media.
The Indian case is not just intrinsically important, but also of broader relevance as an example of a market in the Global South characterised by rapid growth in internet access and a significant number of new digital-born news media competing with legacy media for audience attention and engagement. Legacy brands building a digital presence off the back of an existing printed newspaper or television channel still have wider online reach according to Comscore (see Table A1), but several digital-born news media have built significant reach and generate high levels of engagement on social media. In previous research, we have shown how both digital-born and legacy news media in India are actively seeking to build online audiences both on the open web and via social media platforms like Facebook and Twitter (e.g. Aneez et al. 2017).
In this factsheet, we present an empirical analysis of the extent to which new, digital-born news media have challenged the dominance of incumbent legacy news media in India, comparing audience engagement across the web and various social media platforms during the election.
We focus on a sample of 101 of the most important legacy and digital-born news media in India (see Table A1). From this list, we shortlisted 73 and 78 outlets respectively, whose Twitter profiles and Facebook feeds we monitored over a period of two months. In total, we gathered nearly 66 thousand Facebook posts and over 63 million tweets. Moreover, we collected web traffic statistics to assess the online website audience of all 101 outlets (when available). The web-browsing data provides us with a benchmark to assess the difference, if any, between the distribution of audience on the web and the two social media platforms we cover, allowing us to understand cross-platform online audience engagement.
Key Findings
We find that:
Regional news outlets2 dominate the provision of political information on Facebook. In each election phase, vernacular language newspapers lead the ranking of most active news outlets on the platform by a large margin.
Indian broadcasters are the second most active in terms of posting political information on Facebook (behind regional news outlets). However, they produce far less news content on Facebook when compared to the leading category, vernacular language newspapers.
On Twitter, digital-born outlets and national daily newspapers are the most active and dominated the provision of news content during the elections. National broadcasters, however, were not far behind, and almost closed the gap during a few of the election phases.
While Facebook was the preferred channel for news distribution for vernacular language newspapers, national outlets, both digital-born and legacy, prioritised Twitter. The platform is widely used in urban areas and among English-speakers, core constituencies for these national outlets.
Turning from supply to demand, we find markedly higher audience engagement (relative to their number of followers) with digital-born outlets, national and regional, on both Facebook and Twitter. During the elections, Great Andhra, One India and The Wire, for instance, recorded the highest engagement per follower on Facebook; whereas on Twitter, BBC India enjoyed the highest level of engagement with their audience during the elections. Legacy media generally see lower levels of audience engagement relative to their follower numbers on both Facebook and Twitter.
Looking at the most viral pieces during the elections – produced by ABP News and Times Now on Facebook and Twitter respectively – we find that video narratives continue to provide the highest returns in terms of engagement for news outlets on Facebook (in line with what we have found in other countries in previous research). This points to a path for potential growth for news outlets that use video narratives on these platforms.
At the structural level, we find no evidence of audience fragmentation in Indians’ online news consumption, despite growing concerns over political polarisation. Looking specifically at Twitter data, we find that users tend to access news content from a range of different sources. Analysis of web traffic similarly finds no evidence of fragmentation. The existence of active, visible, and vocal partisan minorities engaged in often highly polarised debates (sometimes in orchestrated ways) can create the impression that the overall online environment in India is fragmented along partisan lines, but our research suggest that is not the case.
General Overview
The online media environment in India is mobile-first and platform dominated (Aneez et al. 2019)3. In the last few years, the country has been in the midst of structural changes that have fundamentally affected the media sector, with very rapid growth in mobile internet access and hundreds of millions of Indians turning to search engines, social media, and messaging applications for news, information, and communication. Internet access is far from universal, but mobile web use is spreading quickly and both attention and advertising is increasingly moving online.
A number of new digital-born news outlets have launched and now compete directly with long-established legacy brands building their digital presence off a longer history in print or broadcast, and some of these digital-born sites are increasingly popular and important. Examples include Firstpost, OpIndia, The Quint, and The Wire. Both legacy and digital-born outlets are enmeshed in a highly politicised media ecosystem and subject to attacks from both politicians and activists. This criticism reflects the increasing polarisation in Indian politics and is interlinked with concerns over freedom of the media in the country.4
India is a large and complex market, and different parts of the population use news in different ways. Looking specifically at English-language internet users, one recent study documented how many more Indians identify social media as their main way of accessing news online (24%) than say they go direct to the websites or apps of news media (just 18%) (Aneez et al. 2019). As in many other markets in the Global South, both Facebook and Twitter are widely used by internet users to access news, far more than in the US, UK or most other European countries (see Figure 1). 18% of English-language internet users in India name Twitter as a source of news, and 52% name Facebook (Aneez et al. 2019).
Figure 1. Twitter and Facebook use for news across countries
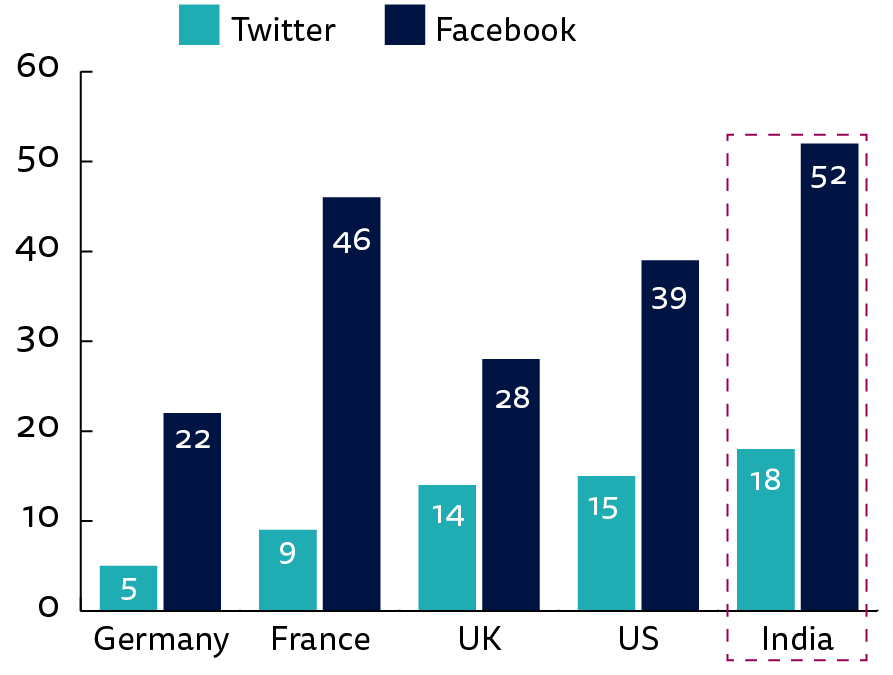
Note: Source data Digital News Report (2019) and India Digital News Report (2019).
Social media (beyond private messaging applications, such as WhatsApp) are thus central to online political communication in India. Narendra Modi, the recently re-elected Prime Minister, has relied heavily on social media since his first election, in 2014, to circumvent legacy news media outlets5 as well as the initial opposition to his candidacy by his own party, the BJP (Das and Schroeder 2019). With almost 48 million followers on Twitter and 44 million Facebook fans, Modi ranks among the most popular political leaders on social media in the world. US President Donald Trump, for comparison, has 61 million Twitter followers and 24 million Facebook fans.
Data Collection
To understand patterns of audience engagement across social media platforms and provide evidence about the rising competition between legacy and digital-born outlets in India, we analyse the online activity of 101 news outlets on Twitter, Facebook and the web during the recent elections in the country (see Table A1 for the full list). We used a strategic sample for this study by combining 1) news outlets with the highest audience reach on the web, as measured by the third-party audience metre Comscore, and 2) news outlets that have enjoyed high visibility on social media and recorded high engagement rates among their followers, independent of their audience reach in terms of website traffic.
As mentioned earlier, India has witnessed a surge in new media outlets in recent years. In order to build a sample of the most representative digital-born outlets, we consulted with Indian journalists and academics, and on that basis included 37 digital-born outlets. These include ‘national’ brands that seek to attract audiences across the country like Dailyhunt and The Quint, as well as ‘regional’ ones like Great Andhara or Valai Tamil, which seek more localised audiences specific to certain states. We also include 64 legacy media outlets in our list, among them 38 regional outlets. Notably, these regional outlets, which publish in the vernacular languages of the states they are popular in, play a very central role in India’s news ecosystem (Figure A1 locates all regional outlets studied here). Some of these regional outlets, for example, Dainik Bhaskar, Amar Ujala and Dainik Jagran, reach audiences that are much larger than those reached by top national news brands (see Table A1 for the complete ranking).6 They achieve this largely by penetrating deeper into specific linguistic regions of the country, rather than widely across several states.
Finally, it is important to note that while our sample does not represent or cover the entire Indian online media ecosystem, it is comprehensive enough to provide a robust assessment of the state of the competition between digital-born and legacy media outlets, and the distribution of news audience attention in the country.
The time window for our analysis includes the entire period spanning the general elections which began on 11 April and ended 19 May 2019. During this period, there were seven polling days (‘phases’) in different states of the country (Figure A1 locates the polling phases).
Search criteria
Figure A2 summarises the Twitter data collection process. Broadly, we aimed to collect all tweets related to the general election during our time window. To do so, we relied on the Twitter Streaming API and used as search queries the names and usernames of political parties and candidates and the news outlets in our list. (In our analysis here we focus specifically on the sample of legacy and digital-born news media).
Additionally, we also used the most important hashtags during the election period to track all conversation around the election. Due to the multithread nature of an electoral event and to avoid missing important tweets mentioning outlets on our list, we monitored Twitter conversations in India by using external tools to identify relevant hashtags every day, and updated our list of queries daily (for a complete description of the process see Majó-Vázquez et al. 2017).
In total, we collected 63,252,755 tweets from which we subset 50,965,208 tweets matching the above-mentioned criteria7. In sum, we followed the Twitter activity of 73 news outlets. However, for the actual analysis, we excluded those outlets that tweeted less than once a day on average during the time window of the study.
As with the Twitter sample, we first manually verified each of the news outlets in our list that had active Facebook pages. Then, we used a third-party tool called CrowdTangle to gather all posts published during the election period by those pages. For our analysis, we only kept those pages that posted on average at least one news piece per day about the election. Finally, we narrowed down to posts only relevant to the elections by applying a set of keyword filters in the English, Hindi, Bengali, Tamil, Malayalam, Telugu, Marathi, Kannada and Gujarati languages (see Table A2). In total, we studied 65,941 posts published by 78 news outlets’ Facebook pages.
Comscore
The final dataset of our analysis was obtained from Comscore, an online audience and traffic metrics firm. We collected the audience data for all the media outlets on our list (when available), for the months of January, February and March 2019. Although the elections officially started on 11 April, the discourse and news coverage surrounding the elections were already very contentious since, at least, the state elections in Chhattisgarh, Madhya Pradesh, and Mizoram in November 2018.
We averaged the available data for the three-month period and used it to trace audience navigation patterns across news media outlets. This web-browsing data offered us a benchmark to assess the differences, if any, between the distribution of audience on the general web and on social media platforms, particularly, Twitter.
Results
News content provision
Figures 2 and 3 summarise the news content provision by media type on social media. As is clear from the visualisation, regional news outlets dominated the provision of political information on Facebook throughout the election period. During each election phase, vernacular language newspapers led the ranking of most active media category on the platform by a large margin. The second polling day, 18 April, was the busiest in terms of content produced by regional outlets, despite not being the phase when the largest number of constituencies went to vote. In total, during phase 2, regional news outlets published 1,294 posts, a significantly greater number than the 549 posts published by national broadcasters, the 361 posts published by the national newspapers and the 302 posts published by digital-born outlets. It is worth mentioning again here that our sample included 38 regional outlets and 37 digital-born sites. Even during the sixth phase of polling, which included Delhi and the surrounding national capital region (NCR), national broadcasters and newspapers still trailed behind vernacular outlets in terms of the volume of news content posted on Facebook.
Figure 2. Volume of Facebook posts over time by media type

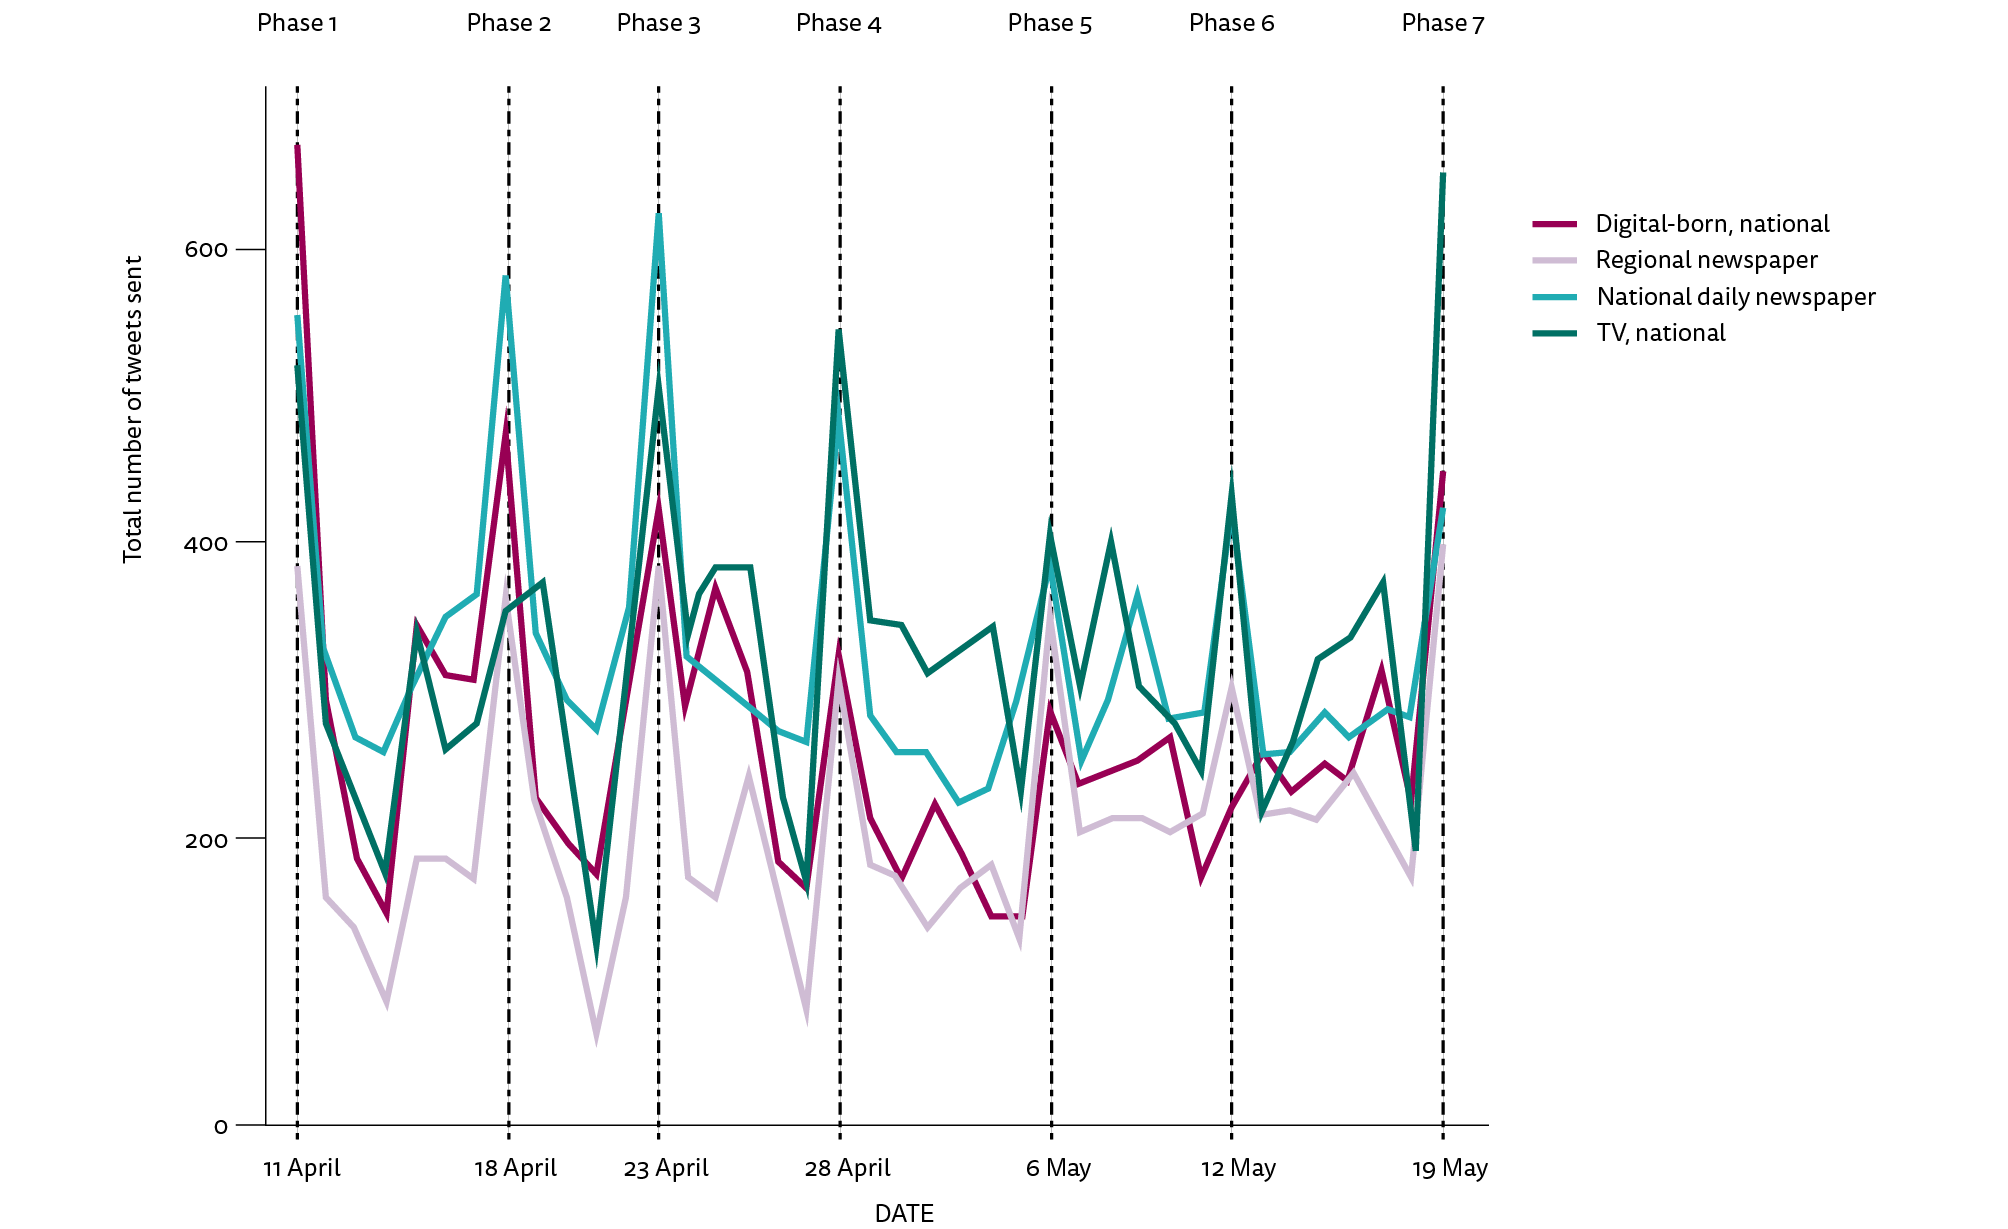
In contrast, an analysis of content produced on Twitter during the election period reveals a very different picture. While no media category enjoys a clear dominance, regional outlets significantly trail behind digital-born outlets, national newspapers and broadcasters in terms of tweeting frequency, as the latter seem to have embraced a platform that enables them to provide fast updates, and facilitates the spread of breaking news. This finding is in line with previous research showing that although Twitter accounts for a small portion of the total traffic from social media, broadcasters like News18 and NDTV still see it as a platform that is in some ways as important as Facebook, though the latter is far more widely used (Aneez et al. 2017).
Figure 3. Volume of tweets over time by media type
Activity rankings
At the individual level (see Table 1) India Today is the most active news provider on Facebook and the second most active on Twitter. Incidentally, while this national magazine, which reaches 13% of the online audience population, is among the most visited news sites in India, in terms of audience reach it is still far behind the two leading news outlets, The Times of India and NDTV. However, interestingly both The Times of India and NDTV distributed less than half the amount of content on Twitter and Facebook that India Today did. Leaving aside the regional news outlets, which, as mentioned earlier, were the most active category, national broadcasters like ABP News, Republic TV, News 18 (on Facebook) and Times Now and India TV (on Twitter) invested the most resources in distributing news content on social media during the elections.
Table 1. Ranking of the 20 most active news media outlets on Twitter and Facebook
|
Type |
Brand |
Total Tweets |
Followers |
|---|---|---|---|
|
TV, national |
Times Now |
6402 |
8908131 |
|
Magazine, national |
India Today |
6234 |
5190729 |
|
National daily newspaper |
Hindustan Times |
5362 |
6776071 |
|
TV, national |
News 18 |
5114 |
4177604 |
|
Digital-born, national |
The Quint |
3735 |
287912 |
|
National daily newspaper |
Times of India |
3006 |
11806259 |
|
National daily newspaper |
The Indian Express |
2593 |
3112332 |
|
TV, national |
India TV |
2273 |
697204 |
|
Regional newspaper |
Amar Ujala |
2210 |
807934 |
|
TV, national |
NDTV |
2154 |
11441545 |
|
TV, national |
News Nation |
2108 |
129616 |
|
Business daily newspaper |
The Economic Times |
2103 |
3222828 |
|
National daily newspaper |
Daily News and Analysis |
1929 |
1994425 |
|
National daily newspaper |
The Tribune |
1829 |
51088 |
|
TV, national |
ABP News |
1771 |
8304506 |
|
Digital-born, national |
Firstpost |
1641 |
2014574 |
|
TV, regional |
Suvarna News 24X7 |
1412 |
96885 |
|
Regional newspaper |
Punjab Kesari |
1410 |
150725 |
|
Regional newspaper |
MaalaiMalar |
1365 |
174257 |
|
Digital-born, national |
OpIndia |
1329 |
144028 |
|
Type |
Brand |
Total Facebook Post |
Page Likes |
|---|---|---|---|
|
Magazine, national |
India Today |
4738 |
9948654 |
|
TV, national |
ABP News |
3652 |
18641014 |
|
Regional newspaper |
Sakal |
3219 |
1441842 |
|
Regional newspaper |
Rajasthan Patrika |
3204 |
6315052 |
|
Regional newspaper |
Amar Ujala |
2934 |
7782895 |
|
National daily newspaper |
Times of India |
2473 |
11110203 |
|
TV, national |
Republic TV |
2116 |
1828726 |
|
TV, national |
News 18 |
1929 |
6272685 |
|
TV, national |
NDTV |
1885 |
7718871 |
|
Regional newspaper |
Deccan Herald |
1857 |
592628 |
|
Regional newspaper |
Dainik Jagran |
1802 |
14423639 |
|
National daily newspaper |
The Indian Express |
1653 |
7152936 |
|
TV, national |
India TV |
1581 |
8079791 |
|
Regional newspaper |
Dinamalar |
1467 |
2752765 |
|
National daily newspaper |
Daily News and Analysis |
1462 |
1376085 |
|
Regional newspaper |
Dinakaran |
1375 |
4077966 |
|
Regional newspaper |
Mathrubhumi |
1286 |
2788679 |
|
TV, regional |
ABN Andhra Jyothi |
1224 |
1316240 |
|
Digital-born, national |
Scroll.in |
1208 |
1548065 |
|
Regional newspaper |
Anandabazar Patrika |
1111 |
5214648 |
Engagement
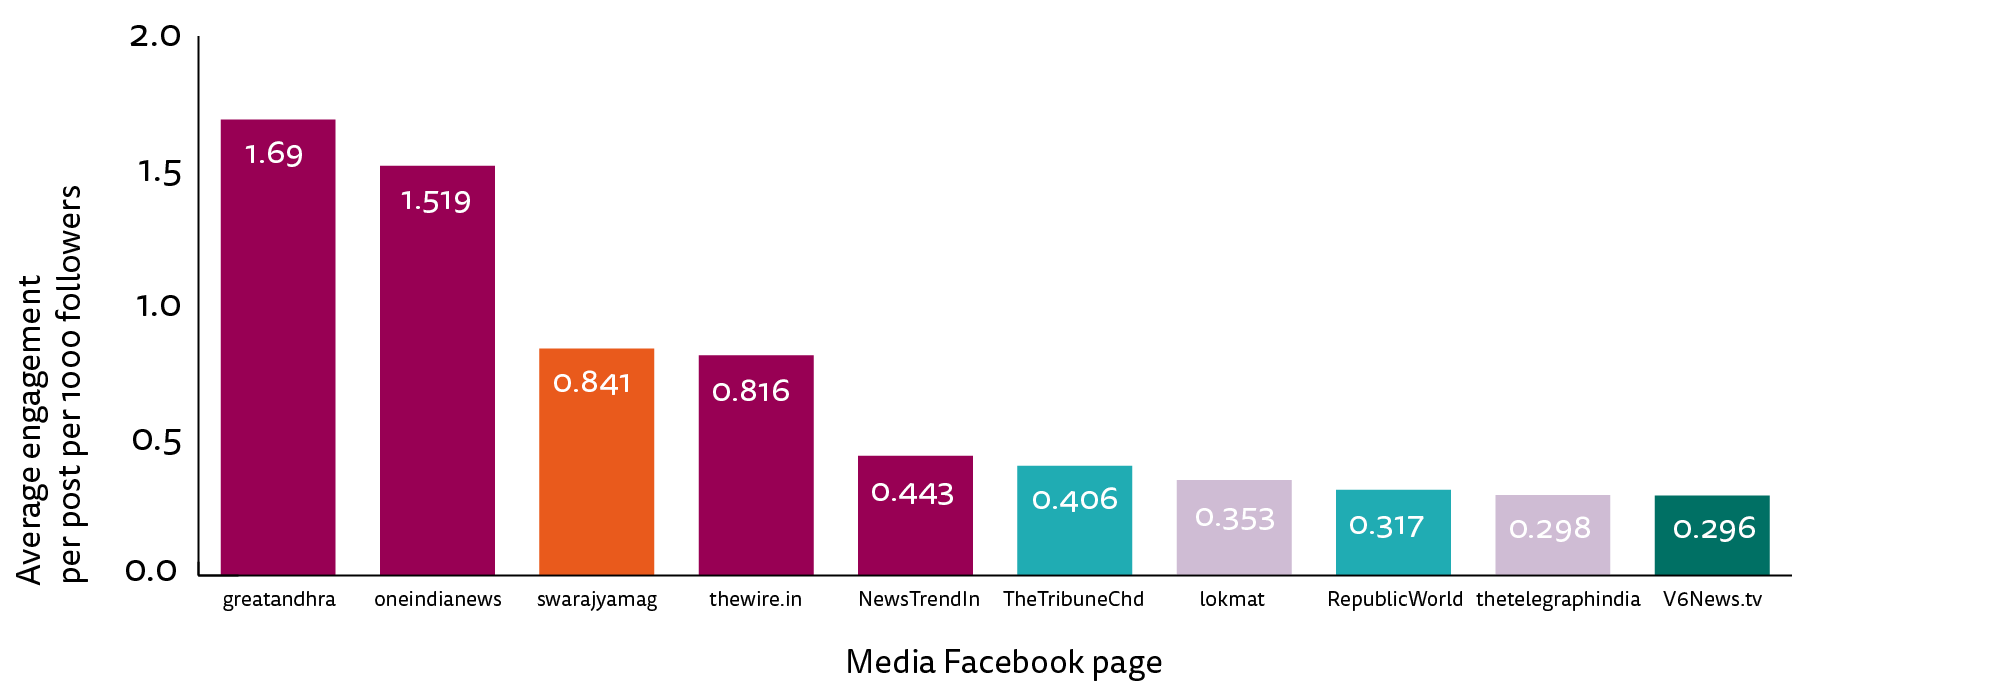
In the absence of data on off-site audience reach – and on the extent to which off-site activity on social media drives traffic to the website or app of a given publisher – we use the total number of interactions generated per content posted on social media as a proxy for audience engagement.8 We therefore analyse the number of interactions around each of the Indian news media outlets in our sample on social media during the election period to understand cross-platform online audience engagement, and to measure the level of engagement around each on social media relative to their number followers. Figure 4 shows that when we control for the number of followers, only Republic TV, which is among the most active news content providers on Facebook, is also among the top ten outlets that recorded the highest engagement during the elections.
Notably, digital-born outlets registered higher engagement per thousand followers or fans on Facebook and Twitter than legacy media did. At an individual level, Great Andhra, One India, Swarajya and The Wire have the highest ratios of engagement per thousand followers per post on Facebook. All of them, with the exception of the national magazine Swarajya, otherwise reach relatively smaller audiences on the web (see Table A1). However, they do enjoy markedly high success in building audience attention on Facebook.
Figure 4. Engagement on Facebook by media outlet
On Twitter, BBC India built the highest level of engagement with their audience during the elections, followed by the national digital-born outlets, OpIndia and Sabrang. Fourth in this ranking is the Deccan Herald, a regional newspaper popular in the southern states of India that published over a thousand posts during the election and received high levels of engagement.
Figure 5. Engagement on Twitter by media outlet

Figure 6. Top Facebook post and tweet by engagement
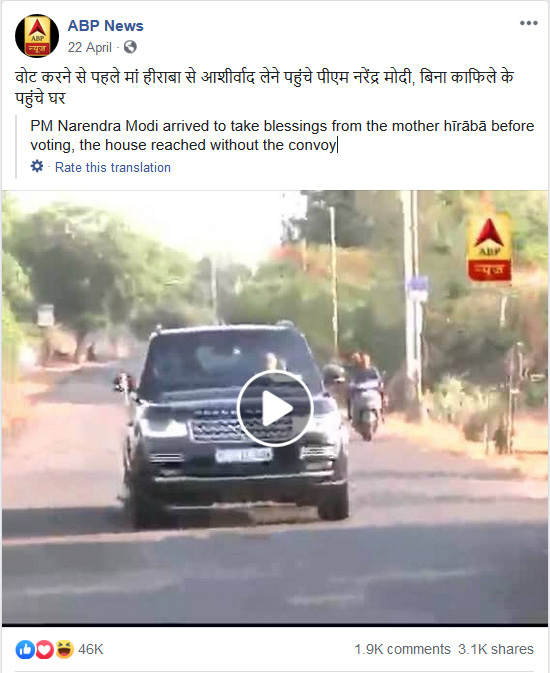
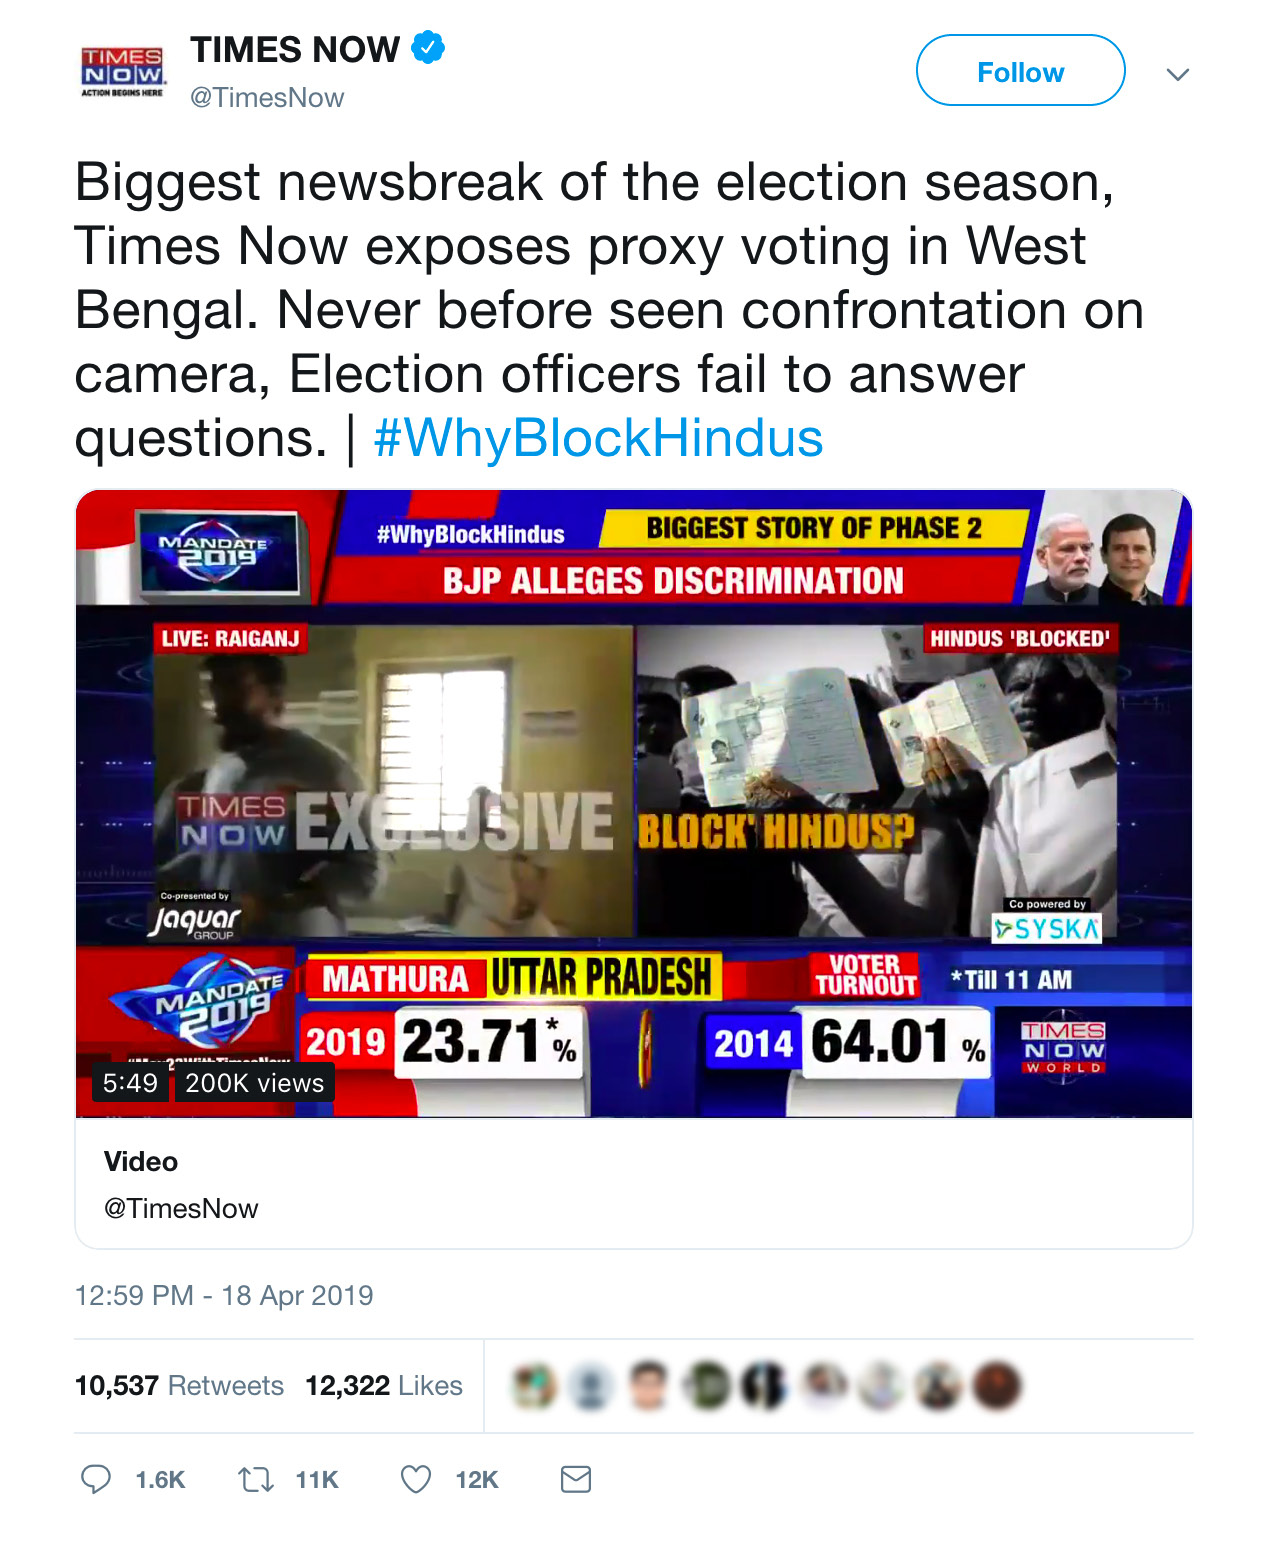
When we look at individual posts, the broadcasters ABP News and Times Now recorded the most engaging posts on Facebook and Twitter respectively (see Figure 6). The fact that these posts went viral suggests that video narratives continue to provide higher returns in terms of engagement for news outlets (in line with what we have found in previous research, eg Majó-Vázquez et al. 2017). To provide evidence that this is the case, we analyse the average engagement for various types of post on Facebook. While the average engagement – including reactions, comments and shares – with photo and URL posts were 364 and 472 respectively, it was as high as 1,053 for live videos and 1,509 for videos on Facebook. YouTube posts, however, did not do too well (average engagement being a meagre 24)9. Overall, this result shows a path for potential growth for news outlets within these platforms.
News Audience Networks
Finally, drawing on previous research on news audience networks, we assess the structure of audience networks of news consumption at the macro level on Twitter and on the web (Mukerjee et al. 2018). We use digital trace data to provide new evidence on the level of distribution of India’s news audiences, assessing whether there is evidence of audience clusters around a few news outlets on Twitter and, if so, whether this is different than that we find on the web.
To do this, we map all retweets, mentions and replies to the outlets on our list on Twitter, and build a network using the following logic: nodes represent the individual outlets, while the edges between them represent the number of Twitter users who replied to, retweeted, and mentioned the corresponding pair of news outlets. This measure, for every pair of outlets, serves as a proxy for the shared exposure to those outlets. By analysing the extent to which the nodes in this network share overlapping audiences when it comes to retweeting, mentioning and replying activity, we can see how the Twitter audience is distributed (or not) across Indian news outlets on the platform. In parallel, we collect similar shared audience data of the outlets’ website traffic as well, from the audience meter firm Comscore. This dataset tells us two things: one, the monthly audience reach for each individual outlet, and the monthly shared audience overlap between every pair of outlets.
Using these two datasets, each of which corresponds to Twitter and website traffic activity respectively, we build the two networks depicted in Figures 7 and 8. In the first figure, we see the Twitter audience network where each node represents the Twitter account of a news outlet and the links between them represent the total number of retweets, replies, and mentions they share. Similarly, Figure 8 shows the website audience overlap network, where each node represents a news website corresponding to the news outlet in our sample. The ties between those nodes measure the amount of audience that they share, averaged over the three-month period. In both networks, the thicker the edge between a pair of nodes, the greater is the overlap between them.
After mapping the audience behaviour on Twitter and the web, we apply a simple algorithm to identify the communities that appear in both networks.10 The higher the number of communities, the greater is the ‘modular’ nature of the network, and thus the level of audience fragmentation. As shown by the modularity scores obtained for each network, we can conclude that there seems to be no evidence of fragmentation, beyond what is expected in any network with the same number of nodes and edges, be it on Twitter or on the web.11 This suggests that both on Twitter and on the open web, Indian online news audience engage with a range of often very different news providers. Despite growing political polarisation, on the whole Indian news audiences still maintain a substantially diverse news diet online, at least in terms of the outlets that they consume news from on Twitter and on the open web.
Figure 7. Twitter networks
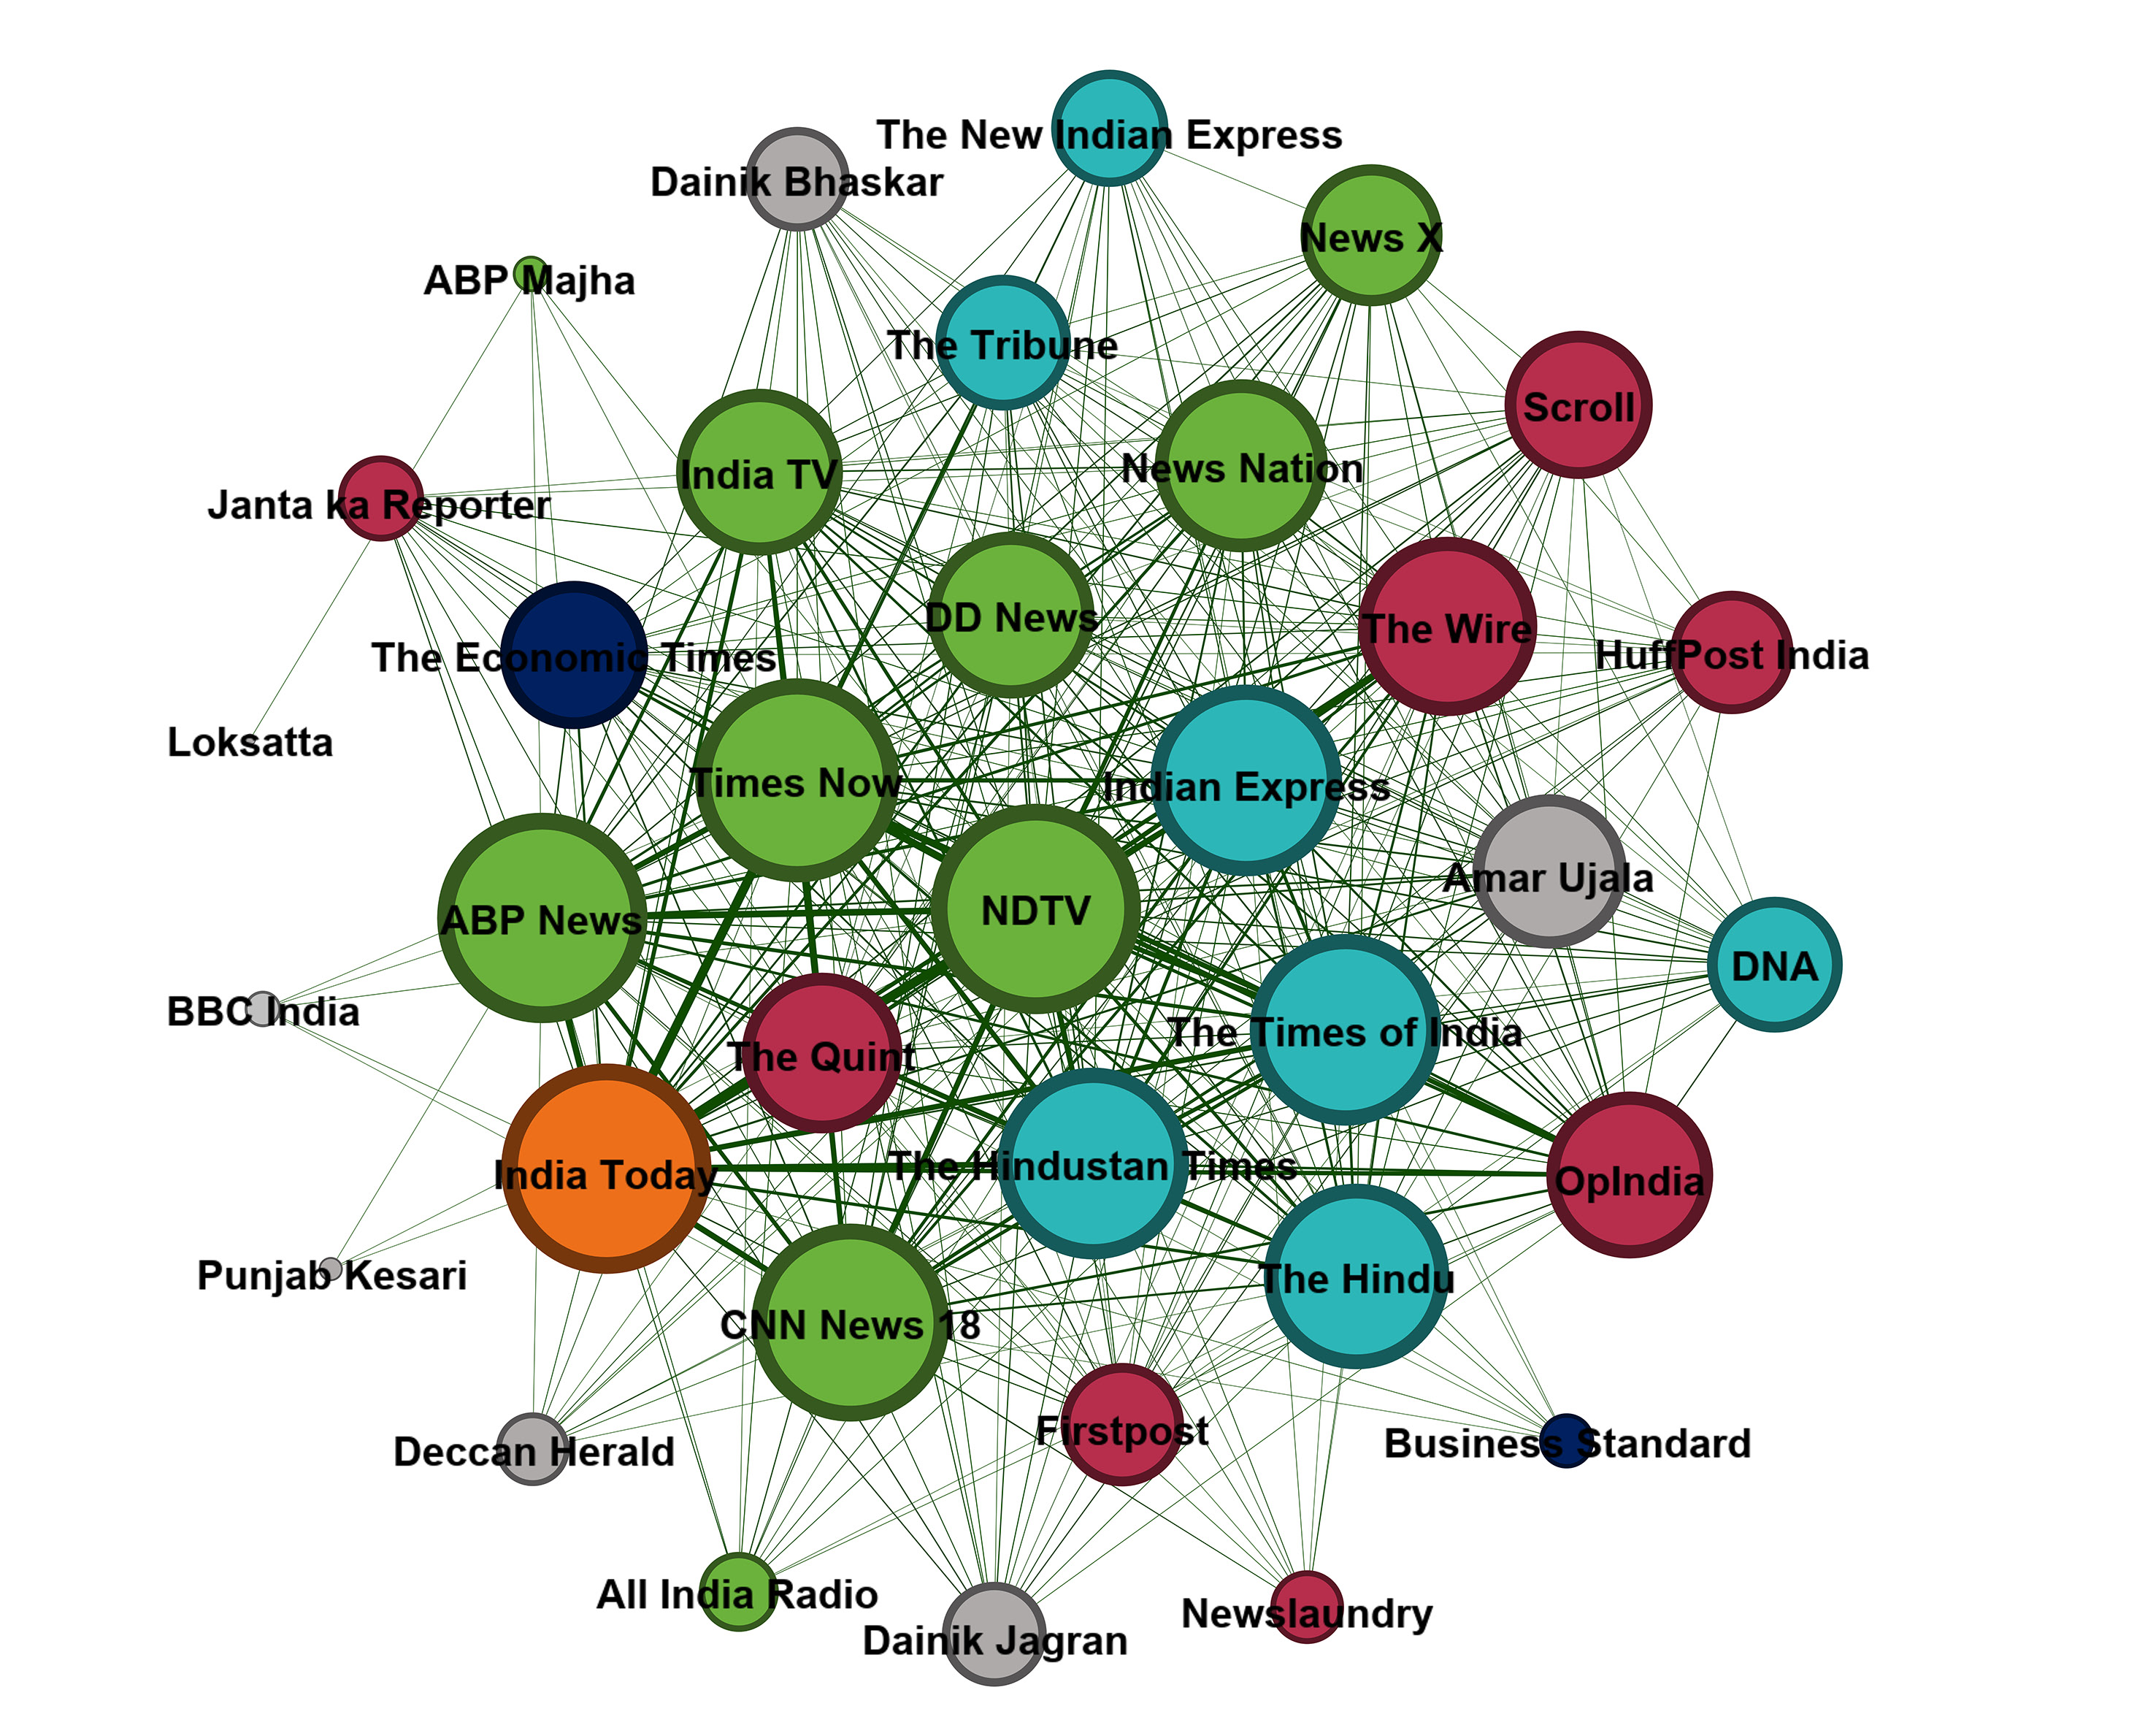
Figure 8. Web audience networks
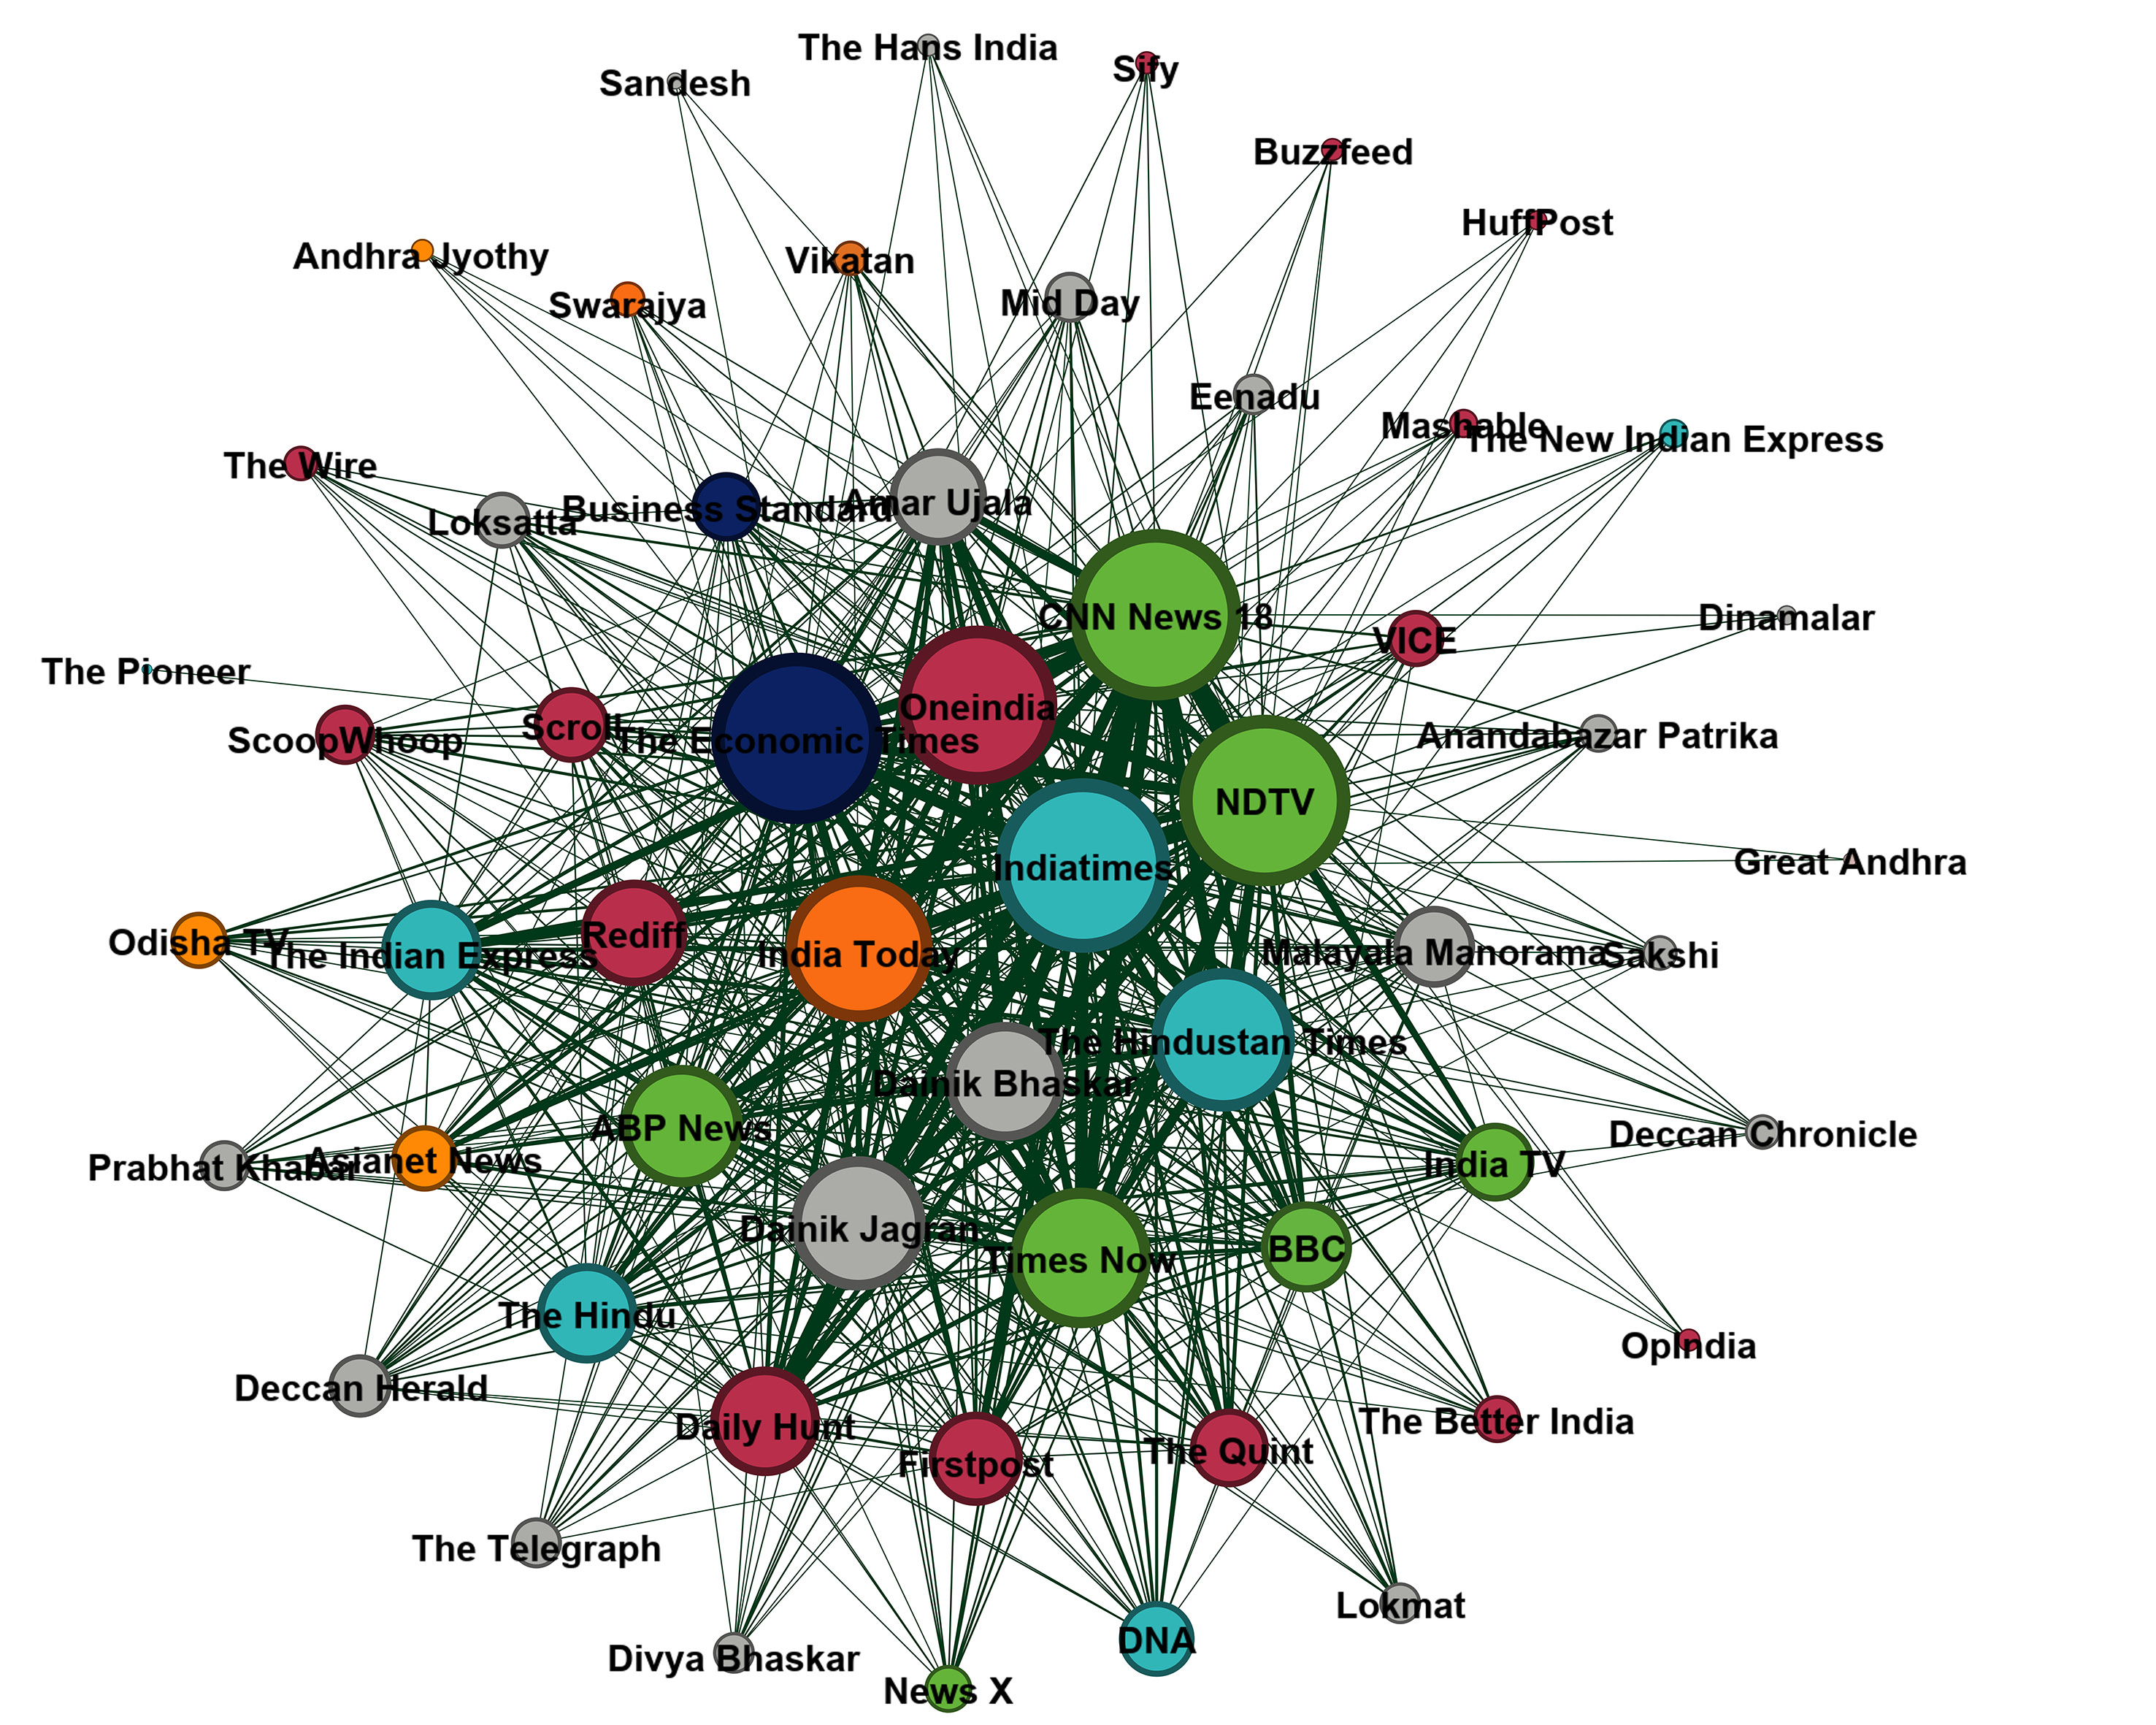
Note for Figures 7 and 8: See Table A1 for the full list of outlets included in the Twitter and web audience analyses. For visualisation purposes, we removed the edges with weights that were less than the average weights in both networks, and only kept the strongest connections. The size of the nodes represents their centrality on the network. The more central a node is, the higher is the number of other nodes it shares overlap with.
A visual inspection of the Twitter networks reveals that the largest legacy news outlets, like The Times of India, NDTV, or the Indian Express, are the most prominent nodes, occupying the most central positions. This means that they share high levels of overlapping interaction with the highest number of nodes in the Twitter network. In other words, Twitter users who interact with these outlets, also tend to interact more with most of the other outlets in the network.
This points to the fact that these users have a relatively omnivorous media diet in so far as exposure to news outlets is concerned. However, while the audiences of the largest legacy news outlets exhibit a more diverse news exposure on Twitter, on the web a variety of digital-born outlets also occupy very central positions along with legacy outlets.
This suggests that the audiences of these newer digital-born outlets also navigate a diverse set of media outlets, including the mainstream legacy outlets, without necessarily being trapped within echo chambers. Our analysis thus provides a reminder that while the existence of active, visible, and vocal partisan minorities engaged in often highly polarised debates (sometimes in orchestrated ways driven by particular political agendas) can create the impression that the overall online environment in India is fragmented along partisan lines, our findings suggests that is not the case overall.
References
Aneez, Z., Chattapadhyay, S., Parthasarathi, V., and Nielsen, R. K. (2017). Indian News Media and the Production of News in the Age of Social Discovery. Oxford: Reuters Institute for the Study of Journalism.
Aneez, Z., Neyazi, T. A., Kalogeropoulos, A., and Nielsen, R. K. (2019). Reuters Institute India Digital News Report. Oxford: Reuters Institute for the Study of Journalism.
Majó-Vázquez, S., Zhao, J., and Nielsen, R. K. (2017). The Digital-Born and Legacy Media News Media on Twitter during the French Presidential Elections. Oxford: Reuters Institute for the Study of Journalism.
Morstatter, F., Pfeffer, J., Liu, H., and Carley, K. M. (2013). ‘Is the Sample Good Enough? Comparing Data from Twitter’s Streaming API with Twitter’s Firehose’. ArXiv Preprint ArXiv:1306.5204.
Mukerjee, S., Majo-Vazquez, S., and González-Bailón, S. (2018). ‘Networks of Audience Overlap in the Consumption of Digital News’. Journal of Communication, 68(1), 26–50. https://doi.org/10.1093/joc/jqx007
Neyazi, T. A. (2011). ‘Politics after Vernacularisation: Hindi Media and Indian Democracy’. Economic and Political Weekly, 46(10): 75-82.
Neyazi, T. A. (2018). Political Communication and Mobilisation: The Hindi Media in India. Cambridge and Delhi: Cambridge University Press.
Newman, M. (2010). Networks: An Introduction. Oxford: Oxford University Press.
Newman, N., Fletcher, R., Kalogeropoulos, A., and Nielsen, R. K. (2019). Digital News Report. Oxford: Reuters Institute for the Study of Journalism.
Das, A., Schroeder, R. (forthcoming). ‘Online Disinformation in the Run-up to the Indian 2019 Election’.
Acknowledgements
The authors would like to thank Jayant Sriram, the senior assistant editor at The Hindu, Ariadna Net València, Prabhat Mishra and Arif Nadaf for their valuable work as research assistants. They also gratefully acknowledge the work of the Data Science Centre of the Graduate School of Economics at the University Pompeu Fabra, specially of Nandan Rao and Richard Knudsen, who assisted us in collecting and analysing the data for this report and accommodated all our requirements. The authors are also very grateful to the research and administration team at the Reuters Institute for input, insight and support: Lucas Graves, Joy Jenkins, Anne Schulz, Richard Fletcher, Antonis Kalogeropoulos, Scott Brennen, Nic Newman, and Alex Reid. They would also like to thank Soma Basu, a journalist in India, for valuable input.
1 The counting day was 23 May 2019. See Figure A1 for all the election phases.
2 In this study, we refer to non-English outlets as regional or vernacular language news media.
3 The study only focuses on English-language Indian news users.
4 India ranks 140 out of 180 countries in the 2019 World Press Freedom Index. https://rsf.org/en/2019-world-press-freedom-index-cycle-fear
5 Before the 2014 election campaign, Modi had not done any interviews with news media outlets, therefore journalists, as well as Indian citizens, had to rely on his Twitter activity to get updates on his political activity.
6 The growing importance of vernacular media in Indian national politics is shown by Neyazi (2011 and 2018).
7 Notably, the extensive use of Twitter during the polling days combined with the high percentage of Twitter users, at least among the Indian English-speaking population, pushed us beyond the 1% limit allowed by the Streaming API on several occasions during the data gathering process. An essential drawback of the Twitter Streaming API is the lack of information concerning what and how much data one gets once it reaches the 1% threshold (for an in-depth discussion see Morstatter et al. 2013).
8 The measure of Facebook engagement is built adding the total number of reactions, comments and shares and dividing it by the number of posts and then by the number of followers. Similarly, Twitter engagement includes all mentions, retweets and replies that each outlet receives.
9 This might suggest a limited exposure to YouTube videos on Facebook, which in turn could be explained by the rivalry of the latter with Google which owns YouTube.
10 The algorithm used is a community detection walktrap algorithm (Newman 2010) which attempts to find the communities in a network by simulating the path of a random walker who starts from a random node in the graph. The intuition behind this process is that a perfectly random walker will get trapped within communities in the network, since there are more edges within them than there are without.
11 The modularity scores are -0.0115 for Twitter and -0.0117 for the web network.
About the authors
Sílvia Majó-Vázquez is Research Fellow at the Reuters Institute for the Study of Journalism at the University of Oxford.
Subhayan Mukerjee is a fourth-year doctoral candidate at the Annenberg School for Communication, University of Pennsylvania.
Taberez Ahmed Neyazi is Assistant Professor of New Media and Political Communication at the National University of Singapore.
Rasmus Kleis Nielsen is Director of the Reuters Institute for the Study of Journalism at the University of Oxford.
Published by the Reuters Institute for the Study of Journalism with the support of the Google News Initiative.
Appendix
Figure A1. Map of India election phases and location of regional outlets
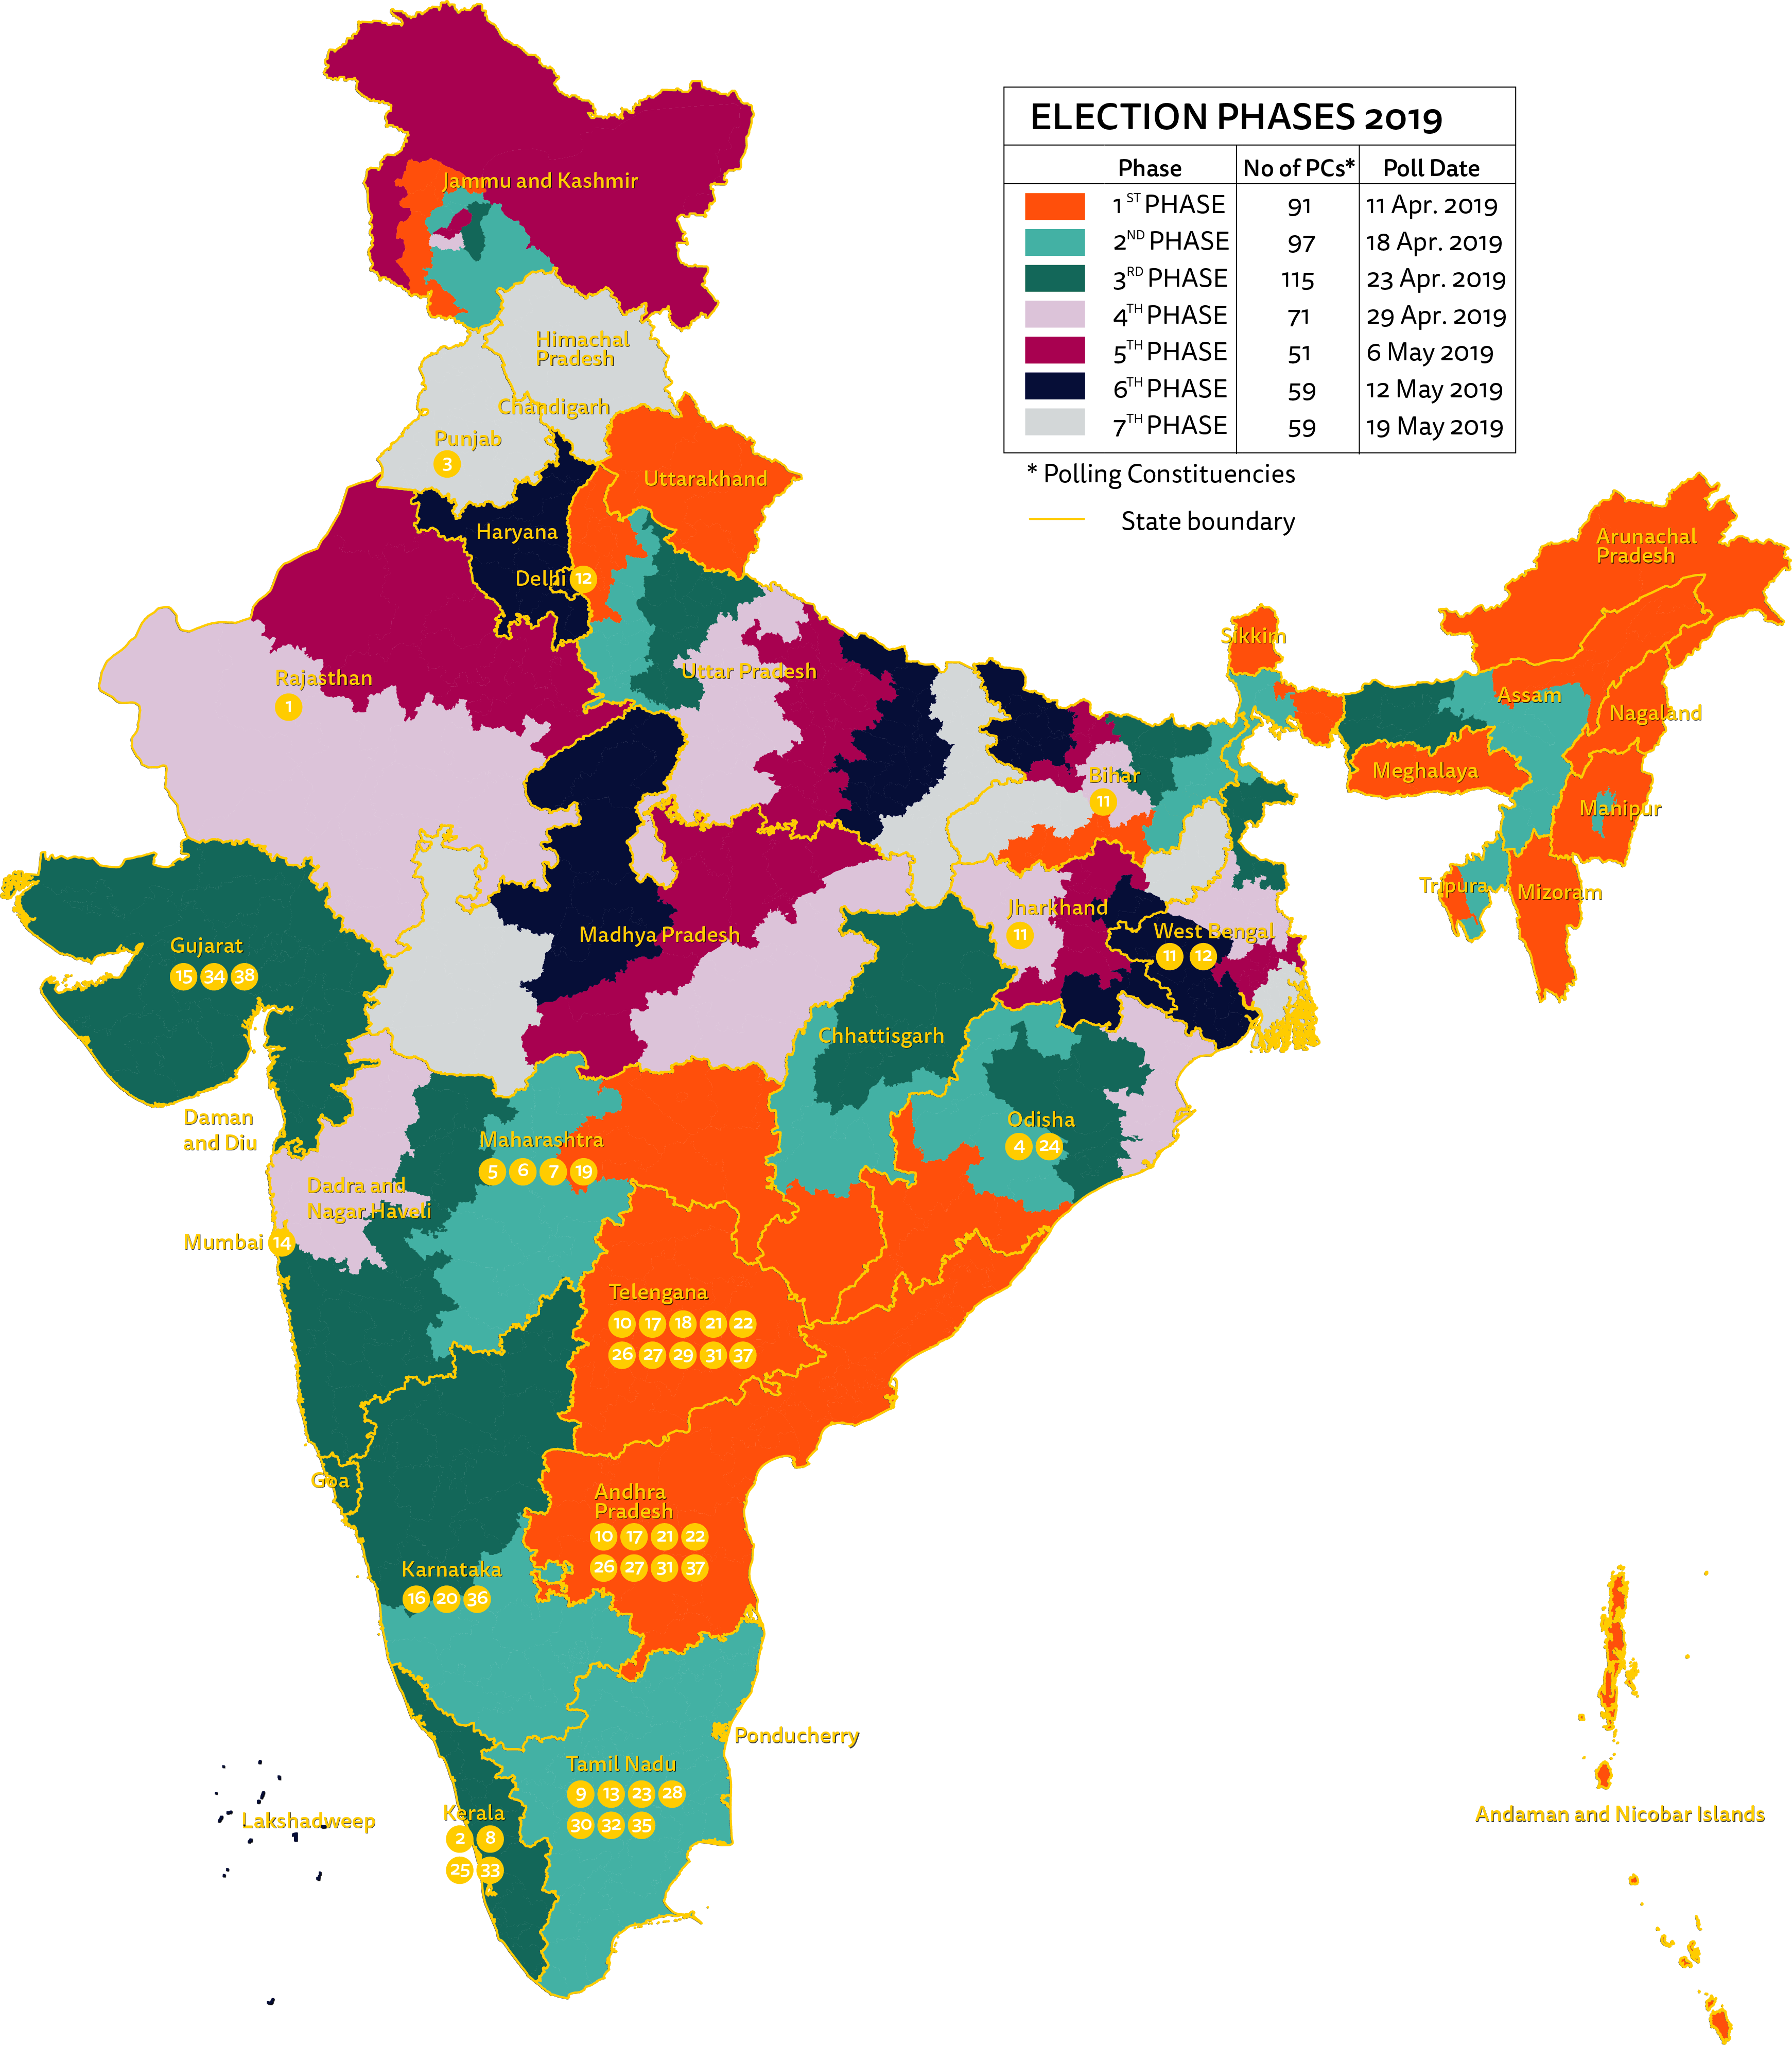
Note: Please see Table A1 to find the reference for the regional outlets located on the map. All regional outlets are located on the map except for those that are widely circulated in more than one third of Indian states e.g., Dainik Bhaskar or Dainik Jagran.
Table A1. Reach of Indian news outlets and list of Twitter and Facebook news pages studied
|
Type* |
Brand** |
Region |
|
|
Online audience reach % |
|---|---|---|---|---|---|
|
National daily newspaper |
Times of India |
✓ |
✓ |
45.9 |
|
|
TV, national |
NDTV |
✓ |
✓ |
22.1 |
|
|
TV, national |
Times Now |
✓ |
21.5 |
||
|
TV, national |
News 18 |
✓ |
✓ |
18.1 |
|
|
Digital-born, national |
Dailyhunt |
✓ |
✓ |
17.1 |
|
|
National daily newspaper |
The Indian Express |
✓ |
✓ |
16.4 |
|
|
Regional newspaper |
Dainik Bhaskar |
North & Central India |
✓ |
✓ |
14.4 |
|
Magazine, national |
India Today |
✓ |
✓ |
13.3 |
|
|
Business daily newspaper |
The Economic Times |
✓ |
✓ |
12.7 |
|
|
Digital-born, national |
One India |
✓ |
✓ |
12 |
|
|
National daily newspaper |
Hindustan Times |
✓ |
✓ |
11.1 |
|
|
Regional newspaper |
Amar Ujala |
North India |
✓ |
✓ |
10.7 |
|
Regional newspaper |
Dainik Jagran |
North & Central India |
✓ |
✓ |
8.6 |
|
Regional newspaper |
Rajasthan Patrika (1) |
Rajasthan |
✓ |
8.1 |
|
|
TV, international*** |
BBC India |
✓ |
✓ |
6.3 |
|
|
Digital-born, national |
Firstpost |
✓ |
✓ |
5 |
|
|
National daily newspaper |
The Hindu |
✓ |
✓ |
4.6 |
|
|
TV, regional |
Asianet News (2) |
Kerala |
✓ |
✓ |
4.4 |
|
Digital-born, national |
India.com |
✓ |
✓ |
3.9 |
|
|
Digital-born, national |
The Quint |
✓ |
✓ |
3.9 |
|
|
TV, national |
ABP News |
✓ |
✓ |
3.1 |
|
|
Regional newspaper |
Punjab Kesari (3) |
Punjab & North India |
✓ |
✓ |
2.9 |
|
Digital-born, national |
Rediff.com |
✓ |
2.7 |
||
|
TV, national |
India TV |
✓ |
✓ |
2.5 |
|
|
Digital-born, national |
The News Minute |
✓ |
✓ |
2.3 |
|
|
TV, regional |
Odisha TV (4) |
Odisha |
✓ |
2.3 |
|
|
Digital-born, national |
Catch News |
✓ |
2.2 |
||
|
Regional newspaper |
Loksatta (5) |
Maharashtra |
✓ |
2.1 |
|
|
TV, national |
NewsX |
✓ |
2 |
||
|
National daily newspaper |
Daily News and Analysis |
✓ |
✓ |
2 |
|
|
Digital-born, national |
ScoopWhoop |
✓ |
✓ |
1.9 |
|
|
Digital-born, national |
Scroll.in |
✓ |
✓ |
1.9 |
|
|
Regional newspaper |
Lokmat (6) |
Maharashtra |
✓ |
✓ |
1.7 |
|
Business daily newspaper |
Business Standard |
✓ |
1.6 |
||
|
National daily newspaper |
The New Indian Express |
✓ |
✓ |
1.5 |
|
|
Digital-born, national |
BloombergQuint |
✓ |
✓ |
1.4 |
|
|
TV, regional |
ABP Majha (7) |
Maharashtra |
✓ |
1.3 |
|
|
Regional newspaper |
Malayala Manorama (8) |
Kerala |
✓ |
✓ |
1.3 |
|
Magazine, regional |
Ananda Vikatan (9) |
Tamil Nadu |
✓ |
✓ |
1.3 |
|
Regional newspaper |
Eenadu (10) |
Andhra Pradesh, Telangana |
✓ |
✓ |
1.3 |
|
Regional newspaper |
Prabhat Khabar (11) |
Jharkhand, Bihar, West Bengal |
✓ |
✓ |
1.3 |
|
Regional newspaper |
Anandabazar Patrika (12) |
West Bengal, Delhi |
✓ |
✓ |
1.3 |
|
Regional newspaper |
Dinamalar (13) |
Tamil Nadu |
✓ |
✓ |
1.1 |
|
Regional newspaper |
Mid Day (14) |
Mumbai |
✓ |
1.0 |
|
|
Regional newspaper |
Divya Bhaskar (15) |
Gujarat |
✓ |
1.0 |
|
|
Regional newspaper |
Deccan Herald (16) |
Karnataka |
✓ |
✓ |
0.9 |
|
Regional newspaper |
Sakshi (17) |
Andhra Pradesh, Telangana |
✓ |
0.8 |
|
|
Digital-born, national |
The Better India |
✓ |
✓ |
0.8 |
|
|
Magazine, national |
Swarajya |
✓ |
0.8 |
||
|
Regional newspaper |
Deccan Chronicle (18) |
Telangana |
✓ |
0.7 |
|
|
Regional newspaper |
Telegraph India |
East India |
✓ |
0.7 |
|
|
Regional newspaper |
Sakal (19) |
Maharashtra |
✓ |
0.7 |
|
|
Digital-born, national |
Mashable India |
✓ |
✓ |
0.6 |
|
|
Type* |
Brand** |
Region |
|
|
Online audience reach % |
|
Digital-born, national |
OpIndia |
✓ |
0.6 |
||
|
Regional newspaper |
Kannada Prabha (20) |
Karnataka |
✓ |
0.6 |
|
|
Digital-born, national |
The Wire |
✓ |
✓ |
0.5 |
|
|
Digital-born, regional |
Telugu 360 (21) |
Andhra Pradesh, Telangana |
✓ |
0.5 |
|
|
Digital-born, national |
Sify.com |
✓ |
✓ |
0.4 |
|
|
Digital-born, national |
India Times |
✓ |
✓ |
0.4 |
|
|
Digital-born, international |
BuzzFeed |
✓ |
✓ |
0.4 |
|
|
TV, regional |
ABN Andhra Jyothi (22) |
Andhra Pradesh, Telangana |
✓ |
0.4 |
|
|
Magazine, national |
Outlook |
✓ |
0.4 |
||
|
Regional newspaper |
Dinamani (23) |
Tamil Nadu |
✓ |
0.4 |
|
|
Digital-born, national |
Khabar247 |
✓ |
0.4 |
||
|
Digital-born, regional |
News Trend (24) |
Odisha |
✓ |
0.4 |
|
|
Regional newspaper |
Mathrubhumi (25) |
Kerala |
✓ |
0.3 |
|
|
Digital-born, regional |
Great Andhra (26) |
Andhra Pradesh, Telangana |
✓ |
✓ |
0.3 |
|
National daily newspaper |
The Tribune |
✓ |
✓ |
0.3 |
|
|
Digital-born, business |
VCCircle |
✓ |
0.3 |
||
|
National daily newspaper |
The Pioneer |
✓ |
0.3 |
||
|
TV, national |
Republic TV |
✓ |
0.3 |
||
|
Digital-born, national |
Janta Ka Reporter |
✓ |
0.3 |
||
|
Digital-born, national |
Vice India |
✓ |
✓ |
0.3 |
|
|
Digital-born, national |
The Huff Post India |
✓ |
✓ |
0.3 |
|
|
Regional newspaper |
The Hans India (27) |
Andhra Pradesh, Telangana |
✓ |
0.2 |
|
|
Regional newspaper |
MaalaiMalar (28) |
Tamil Nadu |
✓ |
0.2 |
|
|
TV, national |
News Nation |
✓ |
✓ |
0.2 |
|
|
Regional newspaper |
Namasthe Telangana (29) |
Telangana |
✓ |
0.2 |
|
|
Digital-born, regional |
Valai Tamil (30) |
Tamil Nadu |
✓ |
0.2 |
|
|
Digital-born, national |
Quartz India |
✓ |
0.2 |
||
|
Digital-born, national |
Youth Ki Awaaz |
✓ |
0.2 |
||
|
Digital-born, regional |
Tupaki (31) |
Andhra Pradesh, Telangana |
✓ |
✓ |
0.1 |
|
Regional newspaper |
Dinakaran (32) |
Tamil Nadu |
✓ |
0.1 |
|
|
Magazine, international |
Forbes India |
✓ |
0.1 |
||
|
National daily newspaper |
The Statesman |
✓ |
0.1 |
||
|
Public service media |
All India Radio |
✓ |
0.1 |
||
|
Regional newspaper |
Mangalam (33) |
Kerala |
✓ |
0.02 |
|
|
Magazine, national |
Economic and Political Weekly |
✓ |
0.01 |
||
|
Regional newspaper |
Gujarat Samachar (34) |
Gujarat |
✓ |
0.01 |
|
|
Digital-born, national |
Newslaundry |
✓ |
0.01 |
||
|
Regional newspaper |
Dina Thanthi (35) |
Tamil Nadu |
✓ |
✓ |
n/a |
|
Public service media |
Doordarshan News |
✓ |
✓ |
n/a |
|
|
TV, regional |
Suvarna News 24X7 (36) |
Karnataka |
✓ |
n/a |
|
|
Digital-born, national |
Sabrang |
✓ |
n/a |
||
|
Digital-born, national |
India Spend |
✓ |
✓ |
n/a |
|
|
TV, regional |
V6 News (37) |
Andhra Pradesh, Telangana |
✓ |
n/a |
|
|
Digital-born, national |
The Logical Indian |
✓ |
n/a |
||
|
Digital-born, national |
NYOOOZ |
✓ |
n/a |
||
|
Digital-born, national |
Firkee |
✓ |
n/a |
||
|
Digital-born, national |
The Post 24 |
✓ |
n/a |
||
|
Regional newspaper |
Sandesh (38) |
Gujarat |
✓ |
n/a |
Note: Twitter and Facebook data are available for those outlets that have a check mark (✓) next to the outlet’s username. The source for online reach and overlap data is Comscore MMX Key Measures, % reach multiplatform, Feb. 2019.
* We use the label ‘regional’ for vernacular language newspapers although some of them are widely circulated in North, Central and East India.
** The number is used for referencing on the map (see Figure A1).
*** BBC India is a website but is labelled as TV to acknowledge its parent legacy brand, the BBC.
Figure A2. Sampling and filtering process
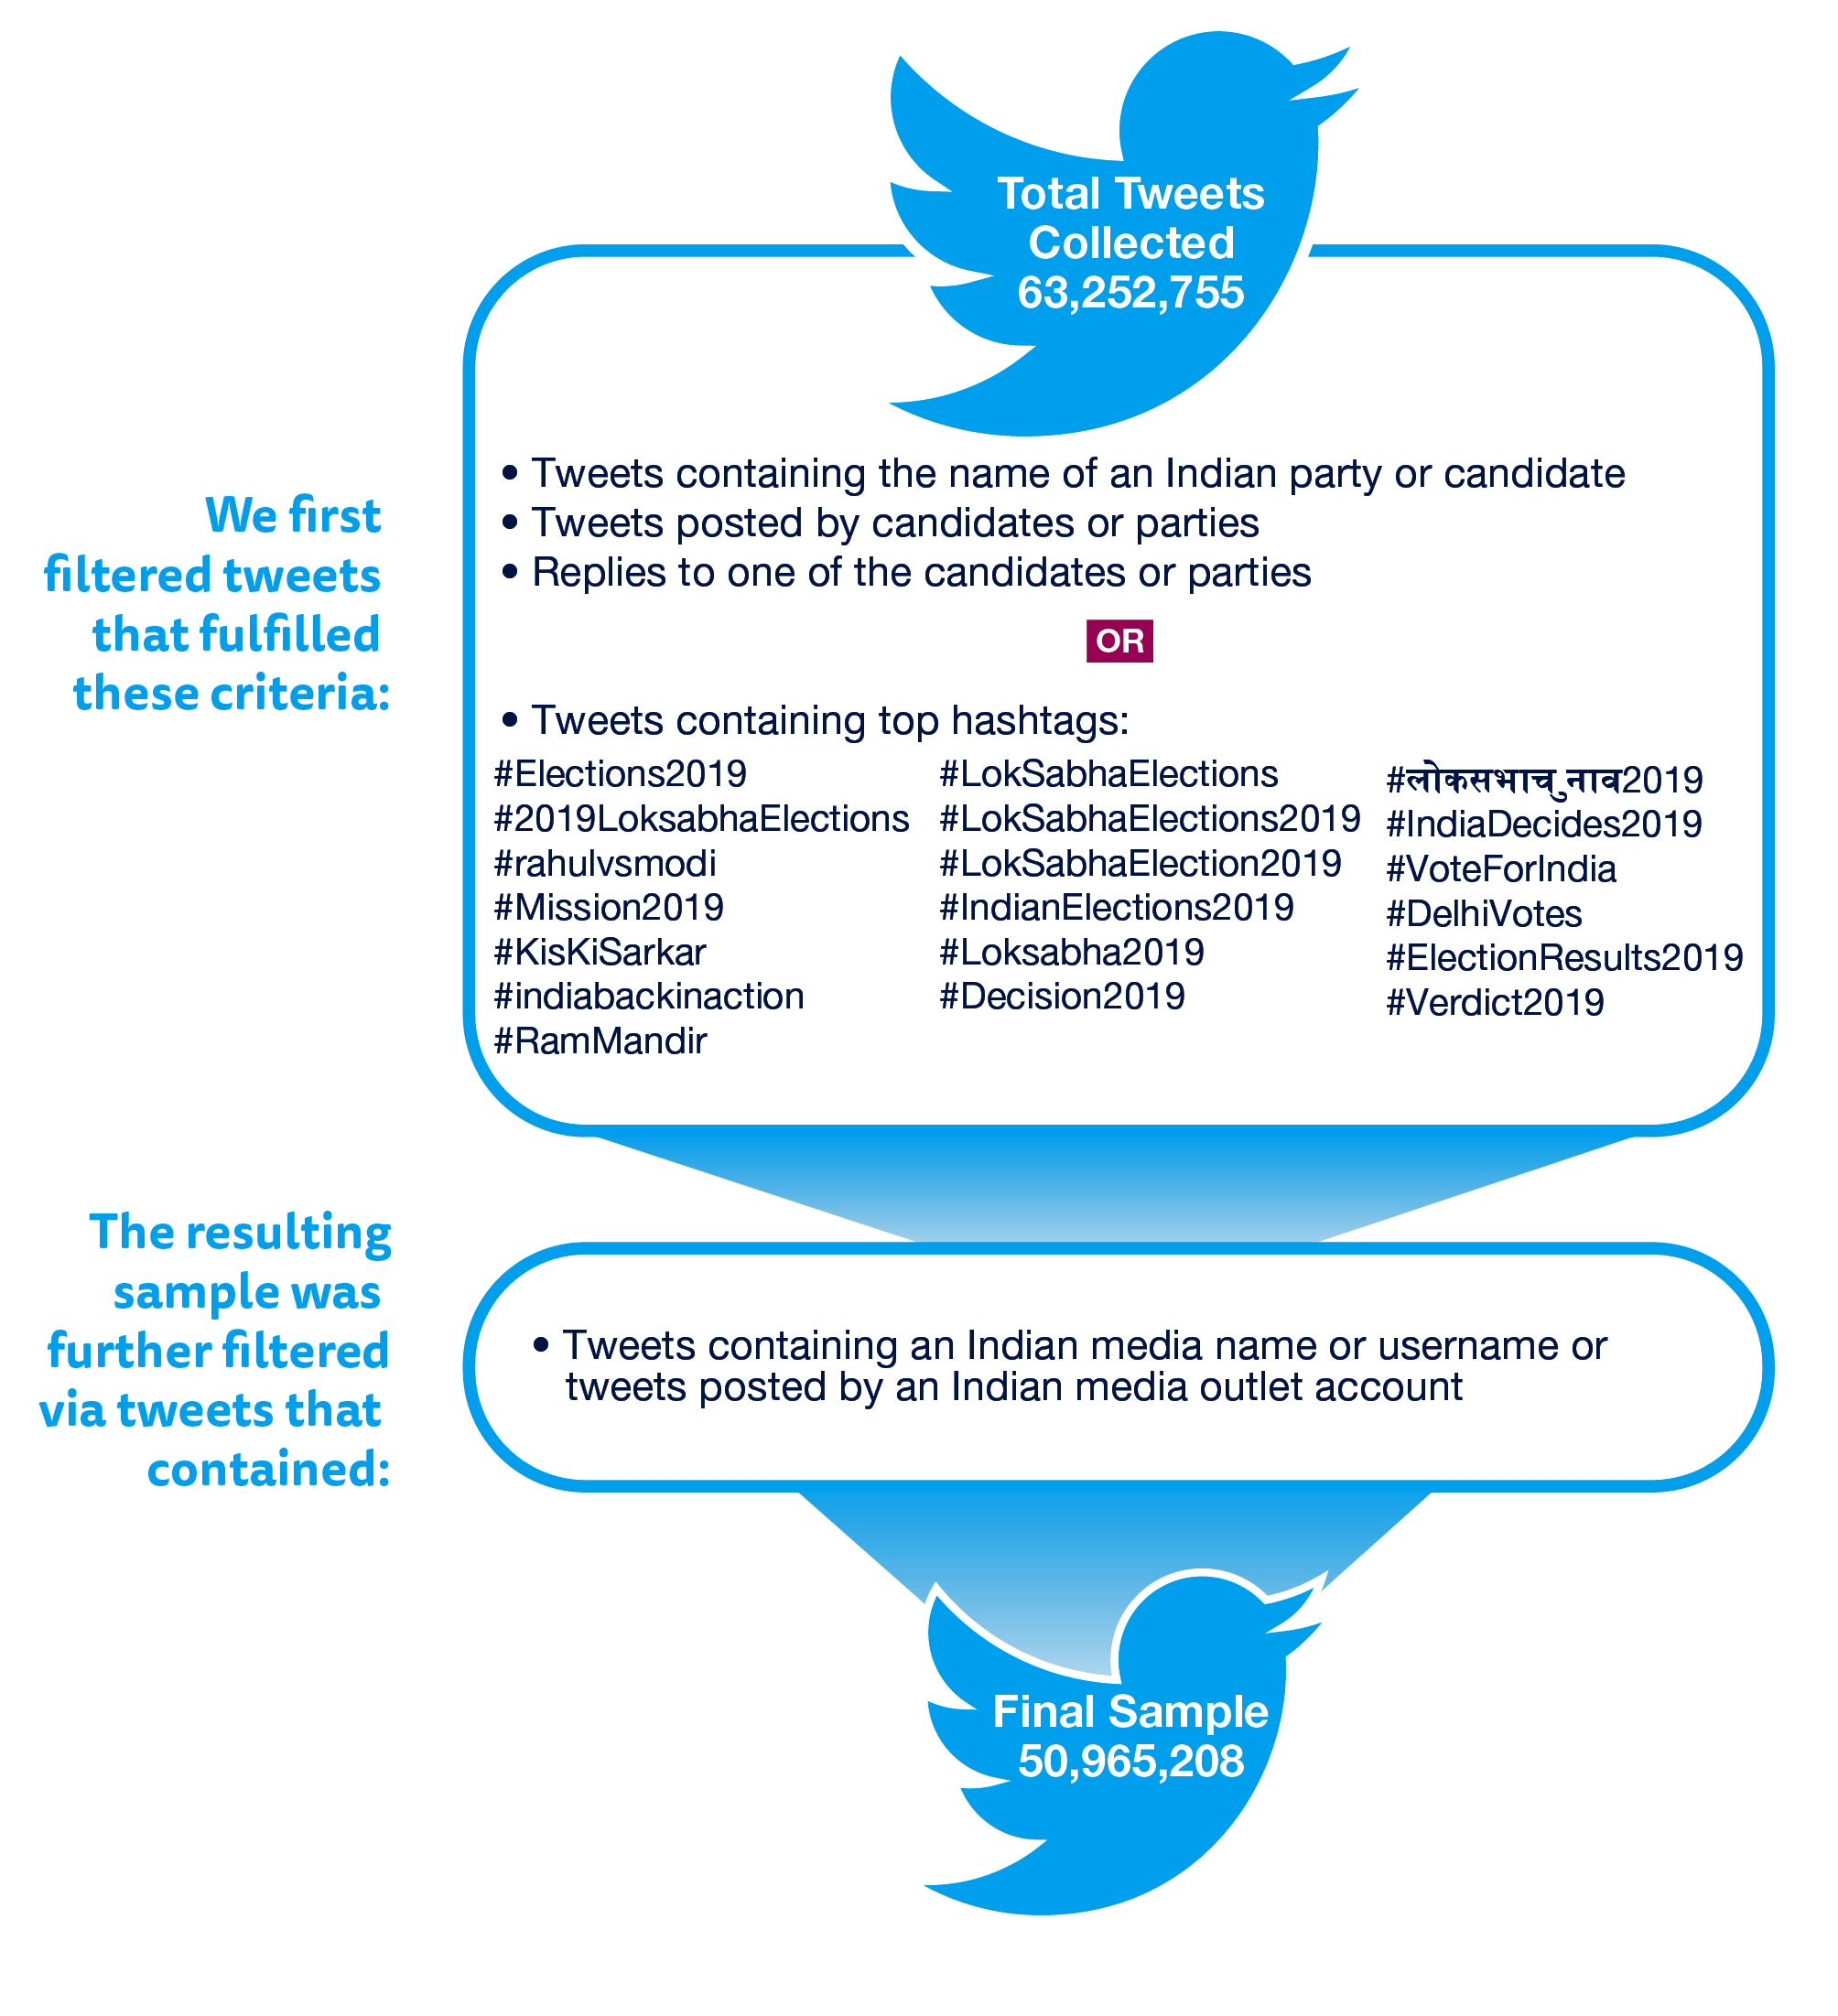
Note: We did not collect tweets including the name of the media outlets on URLs.
Table A2. Filtering Facebook keywords
| election | polling station |
| candidate | circumscription |
| Lok Sabha | Lok Sabha |
| party | #IndianElection2019 |
| rally | #Election2019 |
| politician | #2019LoksabhaElection |
| vote | #LokSabhaElection |
| voting | #LokSabhaElection2019 |
| poll | #Loksabha2019 |
Note: All filtering keywords have been translated into Hindi, Bengali, Tamil, Malayalam, Telugu, Marathi, Kannada, Gujarati. When applicable, plurals are used as filtering keywords too.