

Social inequalities have always shaped news consumption, and as we move from a relatively low choice offline media environment to a high choice online media environment with more intense competition for attention, social inequalities in news consumption may increase.
Previous studies have shown that the expansion of media choice often results in the (information) rich getting richer while the (information) poor get poorer as those who are most interested consume more news, whereas those who are less interested increasingly tune out of news (Prior, 2005). Research has also found that the choices individual news users make are related to their social status (Lindell, 2017).
This factsheet focuses on social inequalities in news consumption in the UK to address the question of whether inequality is increasing as we move to a more digital media environment. Based on survey data on offline and online news consumption and taking into account individual differences in social grade, we find that:
- News consumption is more unequally distributed in the UK than income is, measured on the basis of the number of news sources used on a weekly basis. According to the OECD, the Gini coefficient for income in the UK was .36 in 2015. For offline news consumption, we calculate it at .42, and for online news consumption an even higher .55.
- Online news consumption is more unequally distributed than offline news consumption. One in four individuals do not consume any news online (25%), while only 13% of respondents do not consume any news offline.
- There is greater social inequality in online news consumption than in offline news consumption. Whereas higher social grade individuals and lower social grade individuals use the same number of sources offline on average, lower social grade individuals use significantly fewer online sources on average.
- A key difference between how higher social grade and lower social grade individuals access news online is in terms of direct discovery (going to the websites or apps of news organisations). Lower social grade individuals are significantly less likely to go direct to news providers, whereas lower and higher social grade individuals are equally likely to rely on distributed forms of discovery (relying on social media, search engines, and the like).
- Comparing the reach of individual brands offline and online across different social grades, a number of UK news organisations, including tabloid newspapers and some television channels, have significantly higher reach offline with lower social grade individuals than with higher social grade individuals, just as others, like up-market newspapers, have higher reach amongst higher social grade individuals than lower social grade individuals. Strikingly, however, none of the brands we analyse here have higher reach online with lower social grade individuals, while many have much wider reach with higher social grade individuals.
Our analysis suggests that social inequality in news consumption is already high, that it is likely to increase as we continue to move to a more digital media environment, and that distributed forms of discovery are currently particularly important for news discovery amongst lower social grade individuals, whereas going directly to news organisations online is more the province of higher social grade individuals. Even as there is growing attention to the increasingly visible political polarisation in some people’s news use, we would suggest it is at least as important to pay attention to the less visible but at least as important growing social inequality in news use.
Download ‘Social Inequalities in News Consumption (PDF)’
Approach
To measure social inequalities in news consumption we use data from the 2018 Digital News Report survey in the United Kingdom. Research was conducted by YouGov using an online questionnaire at the end of January/beginning of February 2018. The data were weighted to targets based on census/industry accepted data on age, gender and region to represent the total population of the UK. The sample is reflective of the population that has access to the internet. More details on the method are reported in Newman et al. (2018).1
To examine social inequality in news consumption online and offline, we focus on the number of news sources respondents say they use on a weekly basis, as an indicator of the volume and variety of their news use, and on respondents’ social grade. We focus on the UK as an example of a media environment historically characterised by a combination of strong private publishers and widely-used independent public service media, and as a market with several prominent digital-born news providers with significant reach. The social dimensions of news use will differ from country to country, but we would suggest social inequality may be even greater in countries with less of a tradition of popular tabloid newspapers and less widely used public service media (previous research has suggested especially the latter can reduce information inequality, see e.g. Aalberg and Curran (2012)).
For news consumption, we created two variables measuring the number of news sources used online and offline. For the UK, there are questions for the use of 28 offline news brands, and two questions about ‘other local/regional newspapers’, as well as ‘other newspapers or foreign brands’. For the online environment, we use questions on 32 online news brands in the UK, as well as two broader questions about ‘other local news websites’, or ‘other online sites from outside the UK’. Respondents also had the opportunity to write-in offline and online news sources that were not on the list.
For social grade, survey respondents from YouGov’s panel are classified based on the Market Research Society (MRS)2. Social grade is a widely used classification in market research and social science research in the UK. The classification is based on the occupation level. Respondents were asked approxinately 15 questions about the occupation of the chief income earner in their household. Based on these answers, respondents were classified to A – E categories, where A classification is ‘higher managerial, administrative and professional’ and E classification denotes ‘state pensioners, casual and lowest grade workers, unemployed with state benefits only’. For the purposes of this study, we grouped respondents into two classifications, denoting ‘higher’ (ABC1) and ‘lower’ (C2DE) social grade.
It should be noted that while social grade is an important classification on the socio-economic level, it only reflects some aspects of social inequality. Beyond occupation and its relation to status and income, we hope further research will examine inequalities associated with, for example, age, gender, or ethnicity.
Results
To provide an overall estimate of social inequalities in offline and online news consumption, we use the Gini coefficient, a measure of statistical dispersion which is typically used to measure income inequalities in a population. Higher Gini coefficient denotes higher inequalities. A Gini of 1 denotes maximum inequality (e.g. an individual having all the resources in a country while the rest have none) while a Gini coefficient of 0 denotes equality to the point where all subjects have the same values (e.g. the same income for everyone).
Using the Gini coefficient to measure inequalities in the number of sources UK news users consumed, we calculate it at .55 for the number of the online sources and .42 for the number of offline news sources3. These findings suggest that the online news environment is more unequal than the offline one, and that news consumption is more unequally distributed in the UK than income is. (The Gini coefficient for income inequality in the UK in 2015 was .36 while in the US it was estimated at .394.) While the analogy to income inequality is imperfect (it is easier for an individual to choose to use more sources of news than it is to make more money) we, in line with other researchers (e.g. Hindman, 2008), find it a useful measure for capturing the overall distribution.
Table 1. Gini coefficient in UK news consumption
|
Number of offline news brands used |
0.42 |
|
Number of online news brands used |
0.55 |
As with income, overall distributions and averages summarise a situation characterised by considerable variation. The differences in the number of sources UK news users use offline and online are illustrated in Figure 1 below. More than half of online news users in the UK use zero or one news source online, while offline it is most common to use two or three news sources per week. The median number of sources used online in the UK is 1, whereas offline it is 2. Around a fourth of UK news users do not get news online, while 87% of news users consume news from at least one offline news source per week.
Differences in how many sources of news people use online are based on individuals’ interest in news, but also clearly associated with their social grade. While there are no significant differences between the number of news brands consumed by higher social grade individuals and lower social grade ones offline, we find much greater differences online, as illustrated in Figure 2 (see p.4). Higher social grade individuals use significantly more online news sources (2.11) than lower social grade respondents (1.6)5.
Social inequality in online news consumption is not limited to the average number of news sources used, but also concerns how people get their news and what brands they rely on. Online news discovery can be broadly separated into direct discovery, where people go directly to a news organisation’s website or app to get news, and distributed discovery, where people come across news via an intermediary or platform (for example a social media site or a search engine), and then access stories from there. When we compare the ways in which individuals from different social grades access news online, the differences are clear (Figure 3): higher social grade respondents are significantly more likely to go directly to news organisations than lower social grade respondents (57% to 45%), whereas both groups rely on distributed discovery in very similar ways.6
Differences in news consumption along social grade lines are also clear at the brand level, both offline and online.
As can be seen from Figure 4, there are brands in the UK offline news media landscape that are more popular among higher social grade individuals (e.g. BBC Radio News or upmarket newspapers like The Times), brands that are more popular among lower social grade individuals (e.g. ITV News, tabloid newspapers like the Sun), and brands are that have similar reach across the two social grade groups (e.g. BBC TV News, the Daily Mail).
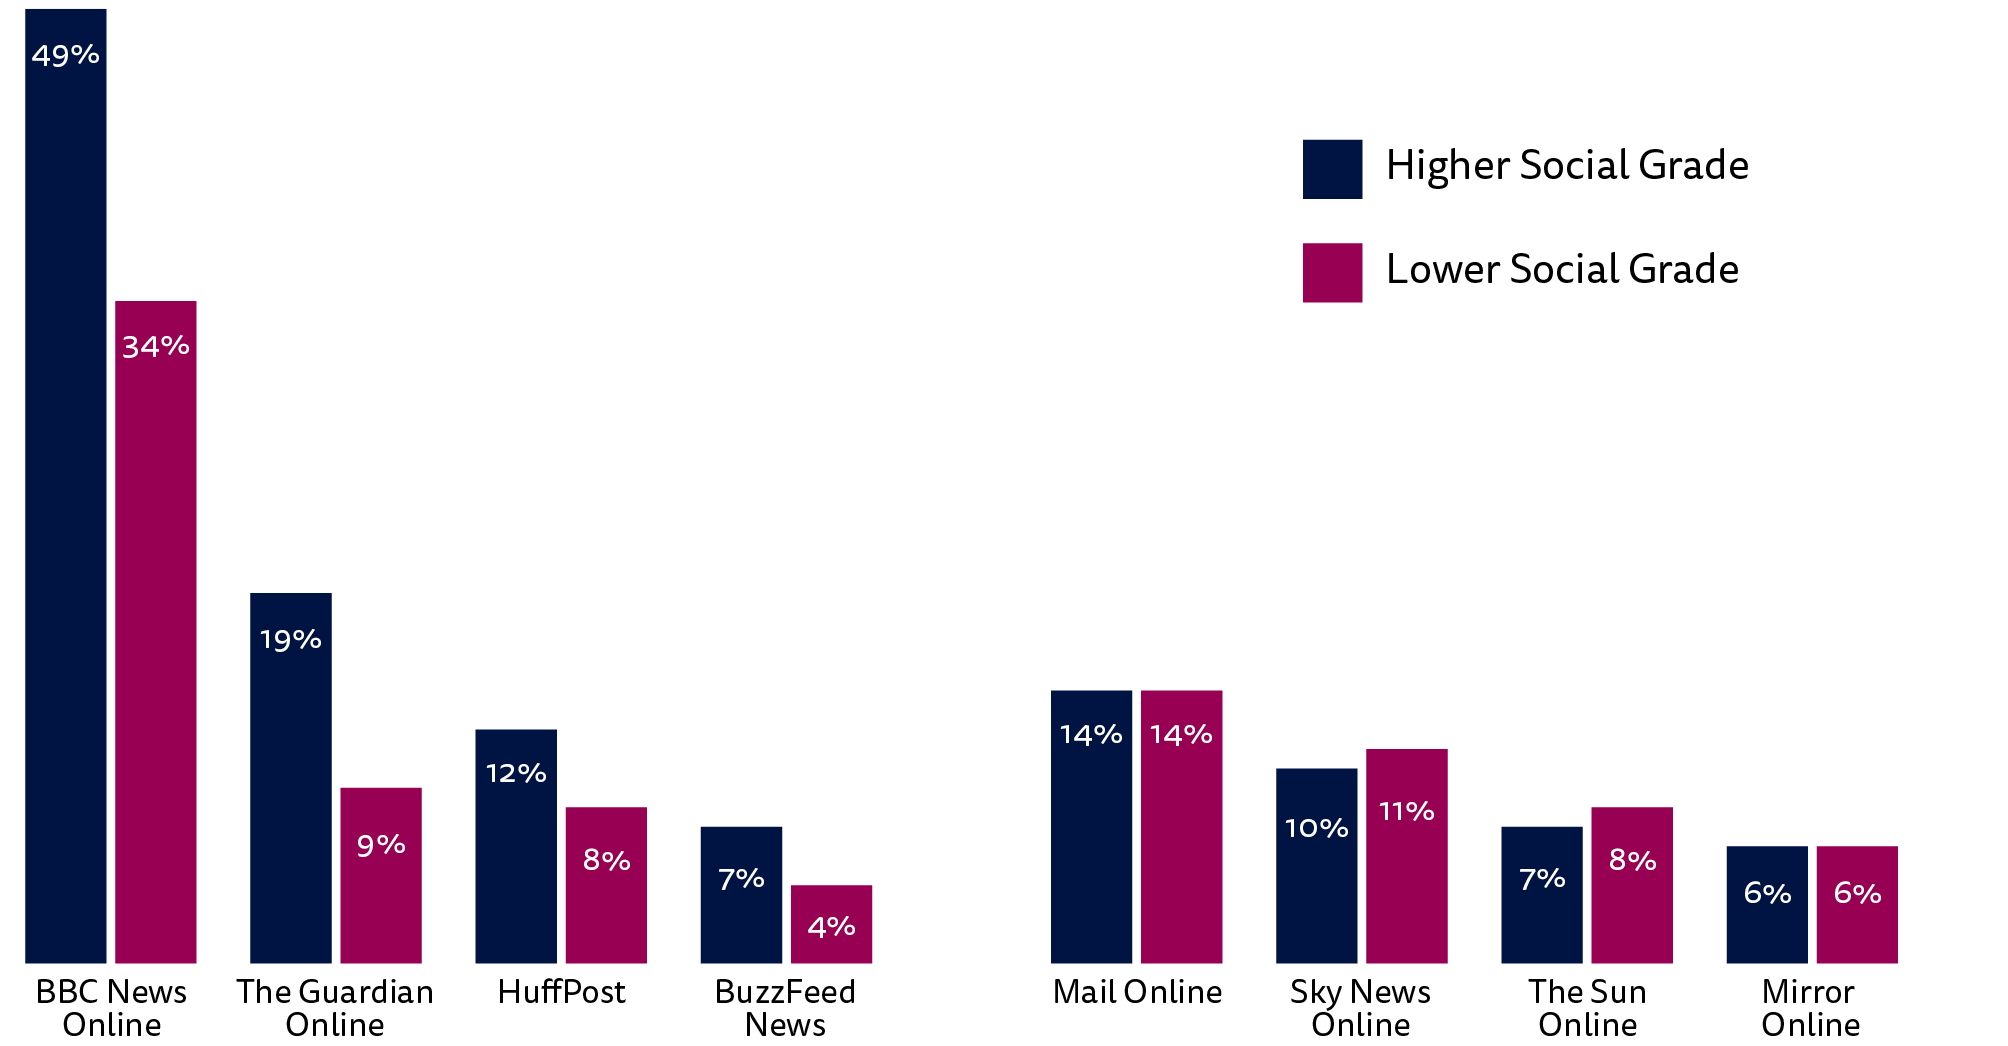
However, when turning to online news consumption (Figure 5, see p.6), we find that there was no online news brand among the 32 included in the survey that had significantly more users from lower social grades. Some outlets are more popular among higher social grade individuals (BBC News Online, Guardian online) and that others have a similar reach among higher and lower social grade individuals (Sun online, Mail Online). But we find no online equivalent to those offline television channels or tabloid newspapers who have successfully built a wider reach amongst lower social grades than amongst higher social grades.
Discussion
In this factsheet, we have documented significant inequality in how much news people in the UK consume, and identified pronounced social inequality in online news consumption specifically. Lower social grade individuals on average use fewer sources of online news, are less likely to go directly to news organisations for news online, and are consequently more reliant on distributed discovery of news via social media and search engines.
Whereas widely used television channels and popular tabloid newspapers with greater reach amongst lower social grade individuals are amongst the factors that help reduce information inequality offline (Aalberg and Curran 2012), we have found no similar patterns online, where no brands have greater reach amongst lower social grade users than amongst higher social grade users. As competition for attention intensifies, scale-based, advertising-funded business models oriented towards a wide audience are under pressure. In response, some publishers increasingly focus on building subscription- or membership-based models primarily based on higher social grade users, and many public service media have more limited reach online with lower social grade users than higher social grade users. These developments mean that the role of platforms like social media and search engines that demonstrably drive ‘incidental exposure’ to news, leading people to more and more diverse news (see e.g. Fletcher and Nielsen 2018) is becoming increasingly important for ensuring that all online news users see at least some news.
As we move towards an increasingly digital media environment, the social inequality documented here is likely to increase. While less visible than the political polarisation of some people’s news use, we would suggest that such social inequalities in news use – here analysed in terms of social grade, but also potentially pronounced in terms of, for example, age, gender, or ethnicity – is at least as important as the question of how highly motivated and often vocal and hence visible partisans use news. In principle, most journalists would like news to reach everybody more or less equally, irrespective of social grade. Despite the ease of accessing news online, today, that is clearly not happening.
References
Aalberg, Toril, and James Curran, eds. 2012. How Media Inform Democracy: A Comparative Approach. Routledge New Developments in Communication and Society. New York: Routledge.
Fletcher, R., & Nielsen, R. K. (2018). Are People Incidentally Exposed to News on Social Media? A Comparative Analysis. New Media & Society, 20(7), 2450-2468.
Lindell, J. (2017). Distinction recapped: Digital News Repertoires in The Class Structure. New Media & Society, 1461444817739622.
Hindman, M. (2008). The Myth of Digital Democracy. Princeton, NJ: Princeton University Press.
Newman, N., Fletcher, R., Kalogeropoulos, A., Levy, D. A. L., & Nielsen, R. K. (2018). Reuters Institute Digital News Report 2018. Oxford: Reuters Institute for the Study of Journalism.
Prior, M. (2005). News vs. Entertainment: How Increasing Media Choice Widens Gaps in Political Knowledge and Turnout. American Journal of Political Science, 49(3), 577-592.
Toff, B., & Nielsen, R. K. (2018). “I Just Google It”: Folk Theories of Distributed Discovery. Journal of Communication, 68(3), 636-657.
Acknowledgements
The authors would like to thank the Reuters Institute’s research team for their constructive comments during the course of their research, and in particular Richard Fletcher for his feedback during the data analysis.
1 It should be noted that the Digital News Report survey screens out people who say that they have not consumed any news online or offline during the past month. In the UK, the share of respondents that were screened out was 7.7%. Given that news avoiders tend to be disadvantaged individuals from lower social grades (Toff & Nielsen, 2018), inequalities in news consumption based on social grade are likely to be even larger if these individuals are taken into account.
2 https://www.mrs.org.uk/
3 The Gini coefficients were calculated using the ineqdec0 STATA package by Prof. Stephen Jenkins.
4 http://www.oecd.org/social/income-distribution-database.htm
5 t = -5.27, p < .001.
6 Social difference carry over to other aspects of news use too. Whereas one in ten higher social grade respondents (10%) say they have paid for digital news content during the past year, only 3% of respondents of a lower social grade have.
Figure 1. Number of news sources used offline and online in the UK
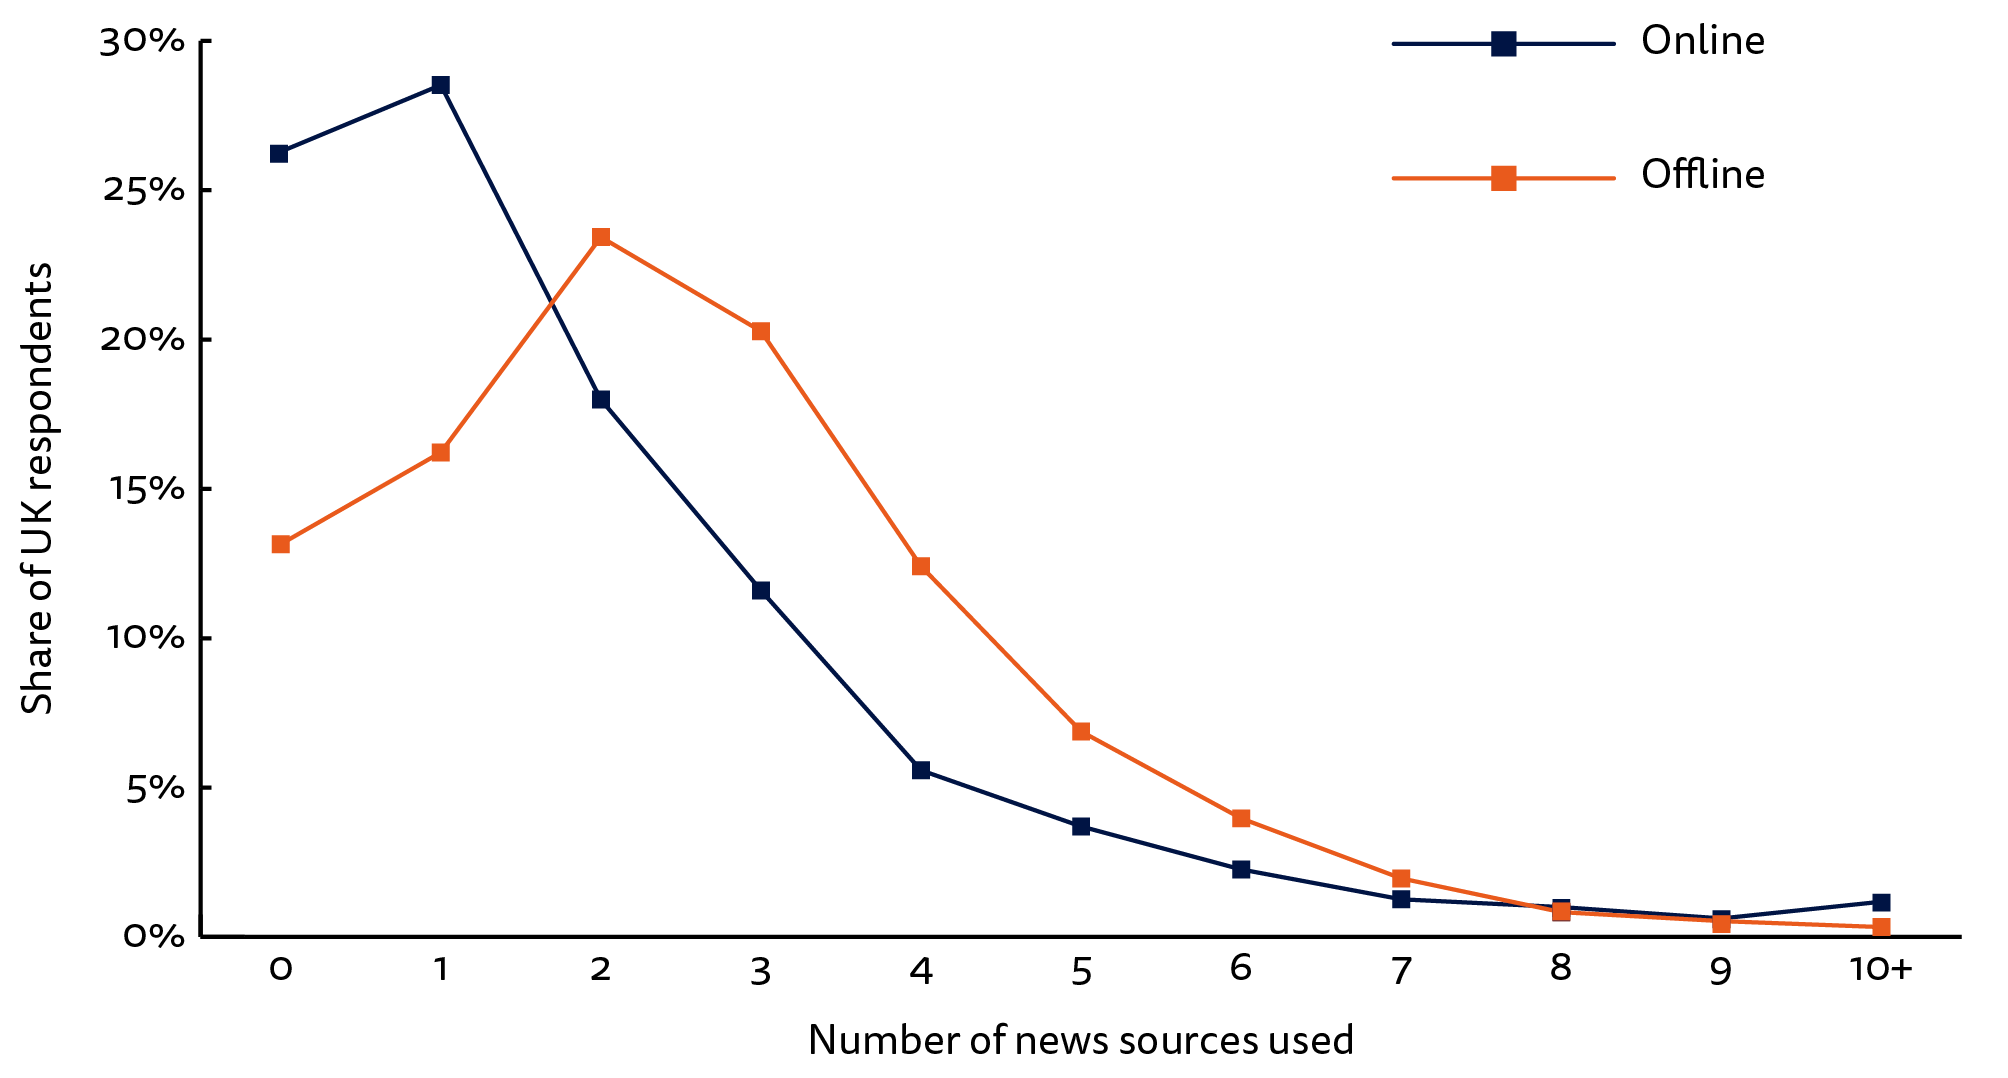
Figure 2. Average number of sources used online and offline by social grade groups
Q5a. Which of the following brands have you used to access news offline in the last week (via TV, radio, print, and other traditional media)? Please select all that apply. Q5b. Which of the following brands have you used to access news online in the last week (via websites, apps, social media, and other forms of Internet access)? Please select all that apply. Base: higher social grade (ABC1): 1292 / lower social grade (C2DE) 759.
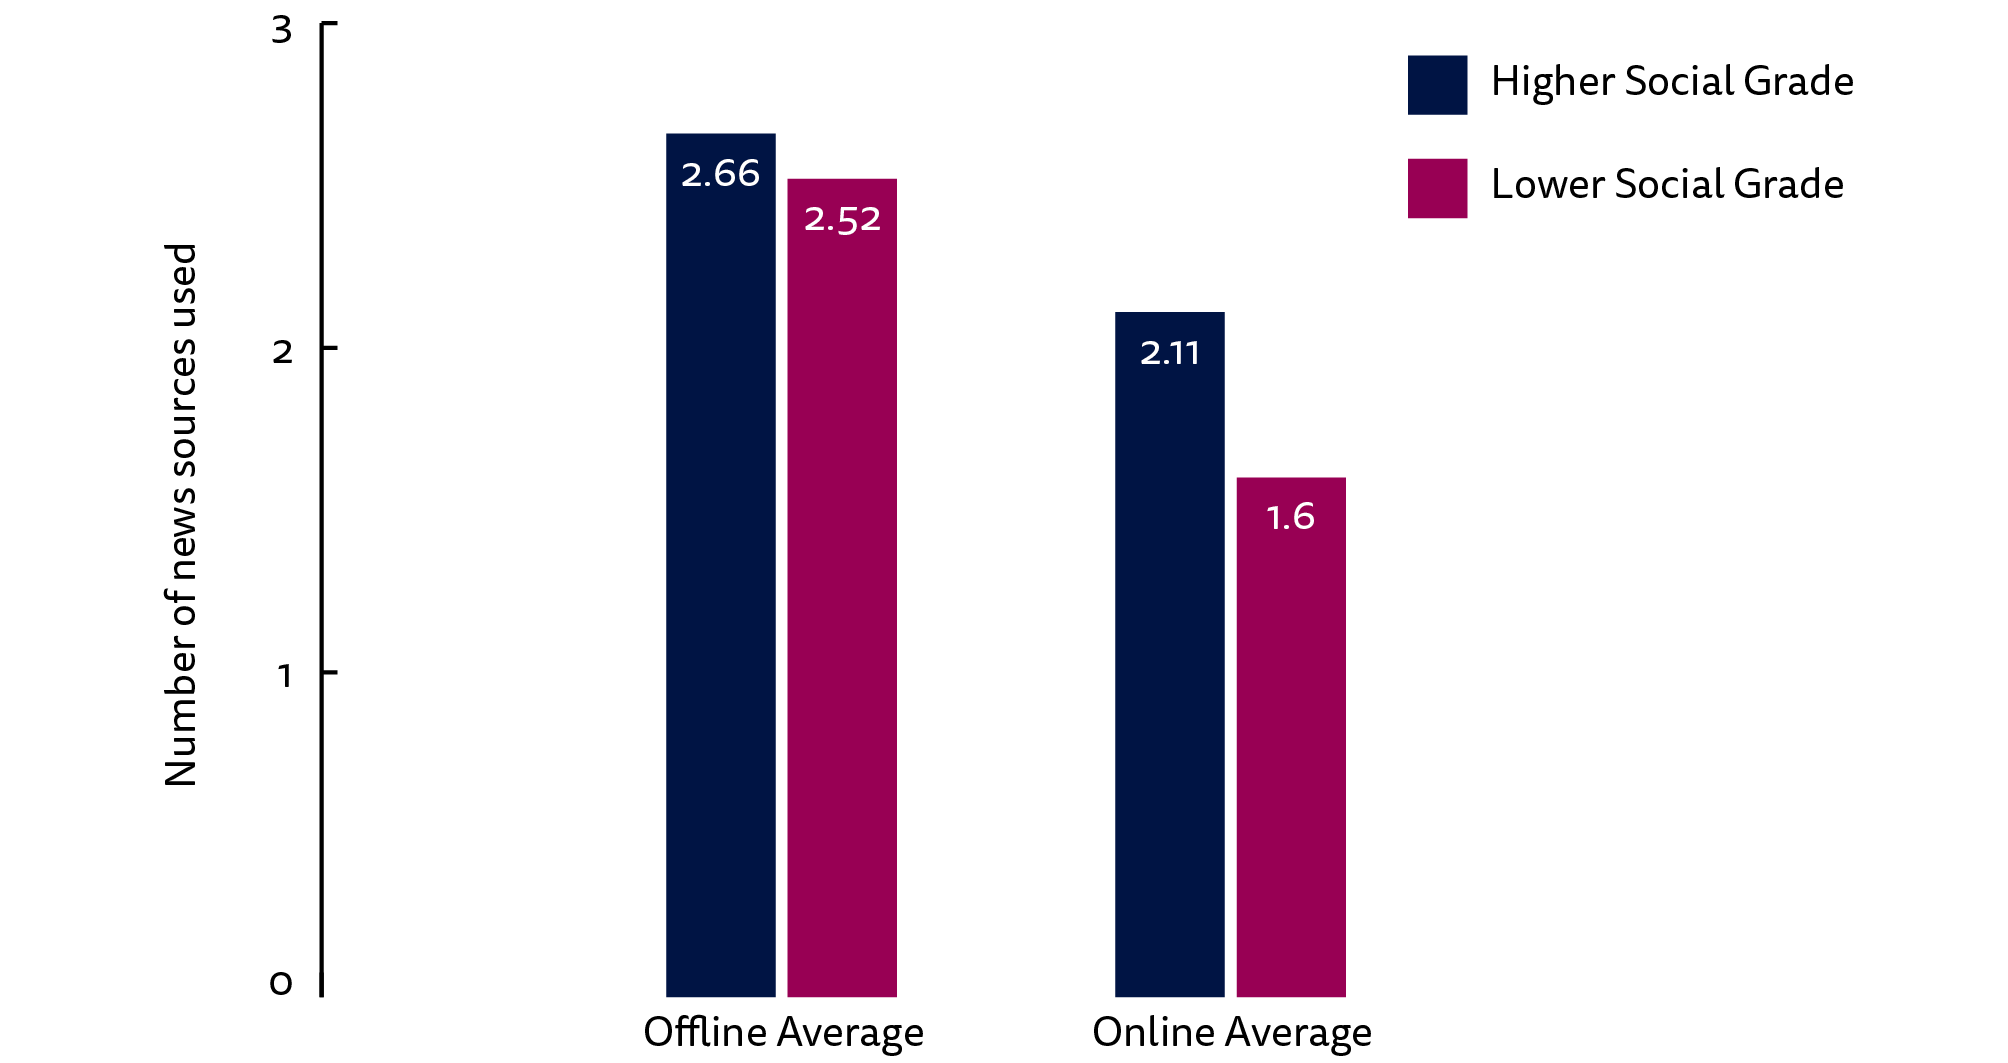
Figure 3. Gateways to news by social grade
Q10. Thinking about how you got news online (via computer, mobile or any device) in the last week, which were the ways in which you came across news stories? Please select all that apply. Base: higher social grade (ABC1): 1292 / lower social grade (C2DE) 759.
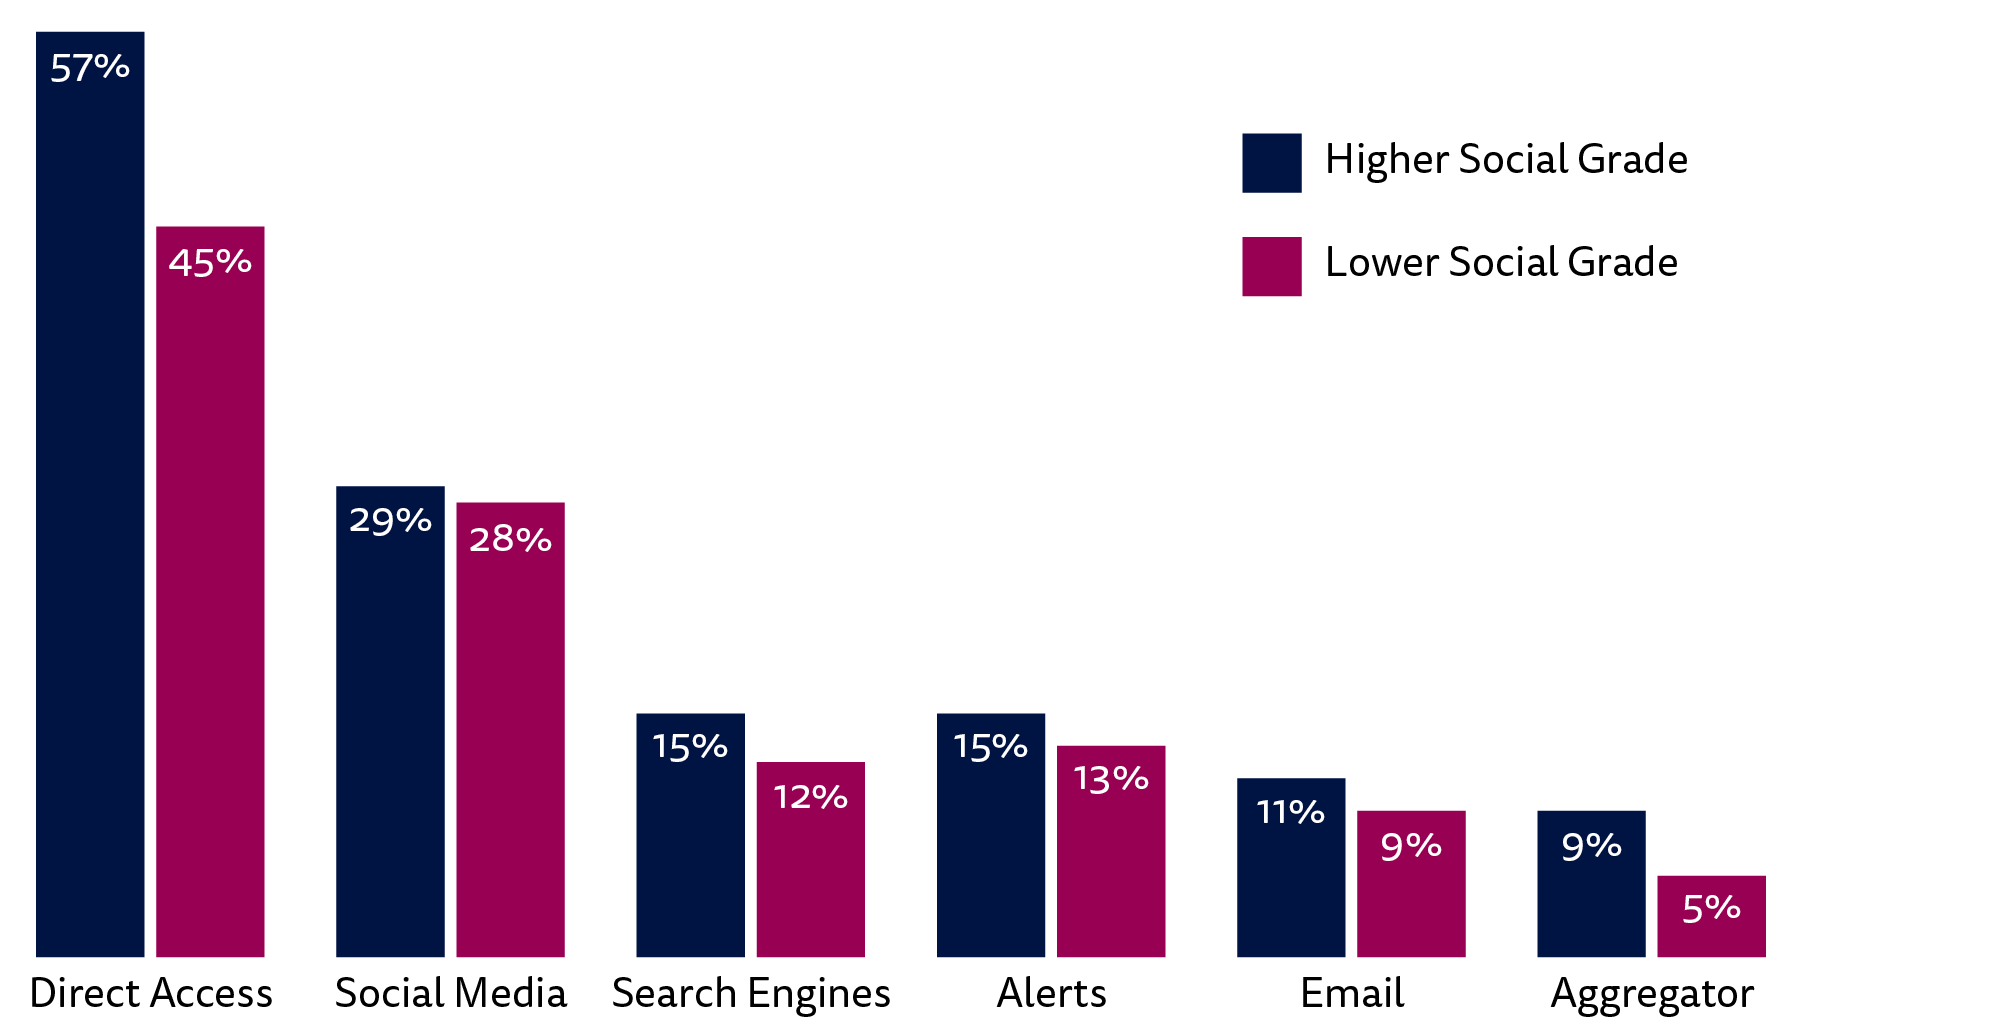
Figure 4. Offline news brand use by social grade
Q5a. Which of the following brands have you used to access news offline in the last week (via TV, radio, print, and other traditional media)? Please select all that apply. Base: higher social grade (ABC1): 1292 / lower social grade (C2DE) 759.
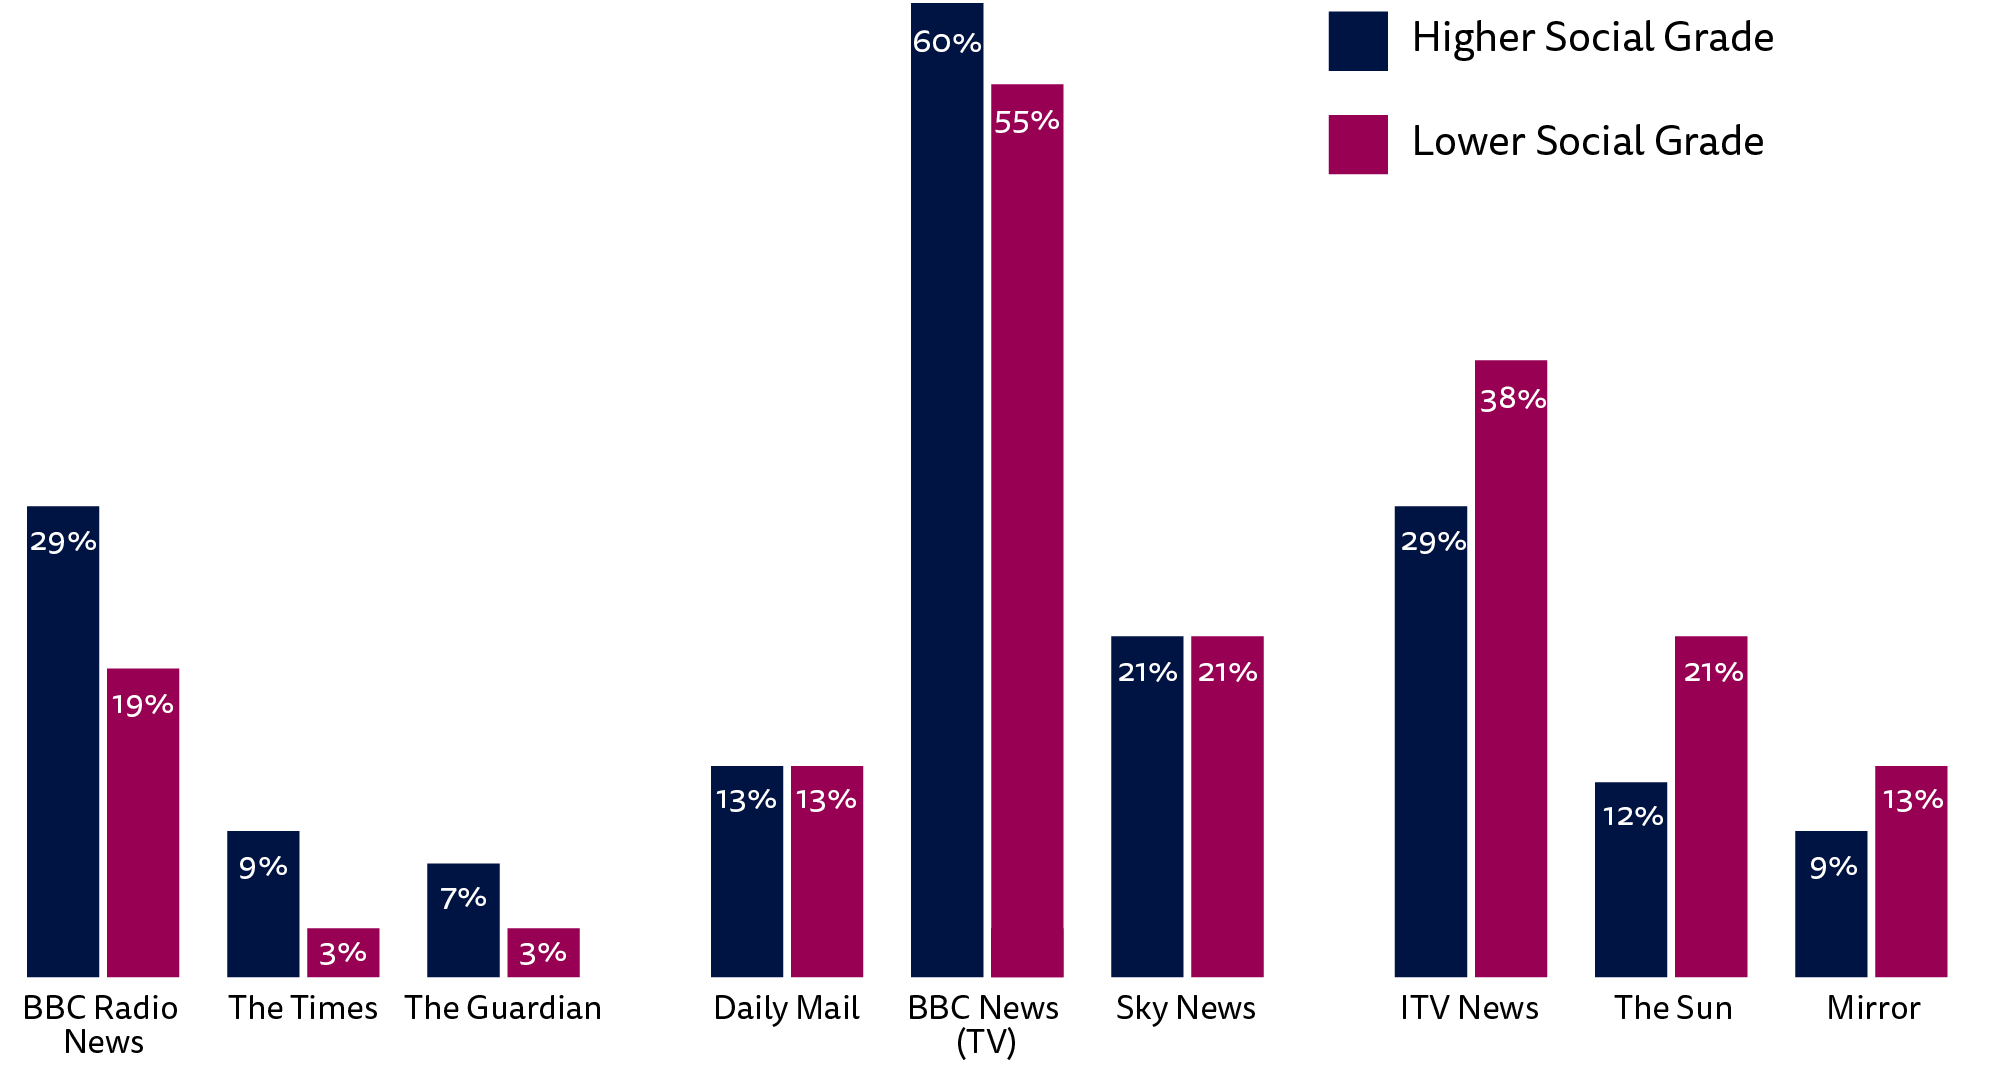
Figure 5. Online news brand use by social grade
Q5b. Which of the following brands have you used to access news online in the last week (via websites, apps, social media, and other forms of Internet access)? Please select all that apply Base: higher social grade (ABC1): 1292 / lower social grade (C2DE) 759.
About the authors
Antonis Kalogeropoulos is a Research Fellow at the Reuters Institute for the Study of Journalism at the University of Oxford
Rasmus Kleis Nielsen is Director of the Reuters Institute for the Study of Journalism and Professor of Political Communication at the University of Oxford
Published by the Reuters Institute for the Study of Journalism with the support of the Google News Initiative.