Skip to content

Digital News Report 2016

  • Home

  • 2016 Report

    1. Foreword
    2. Survey Methodology
    3. Overview & Key Findings
    4. Country Pages
    5. Further Analysis & Comparison
    6. Essays
    7. Interactive
    8. Resources and Charts
    9. Publications
    10. Events
    11. Previous Reports
  • Publications

  • Search

Fig 3.4

Published February 22, 2016 at 1840 × 956 in Editorial Analytics: How News Media Are Developing and Using Audience Data and Metrics.
← Previous Next →

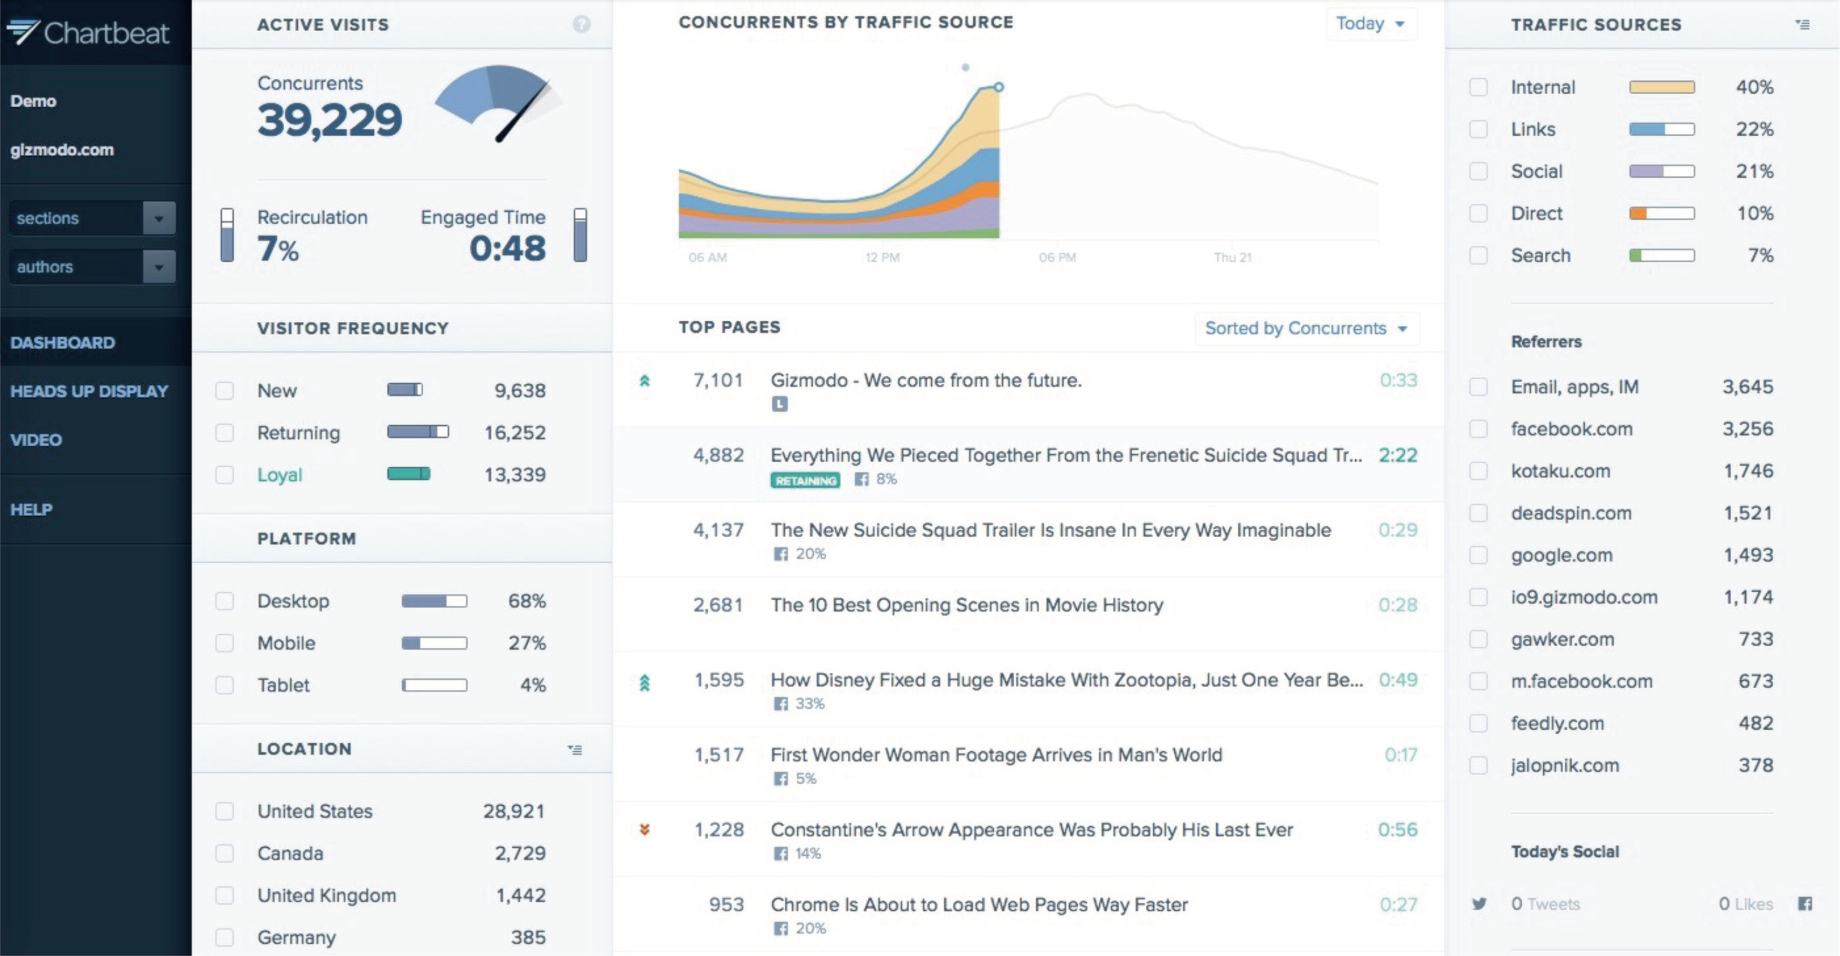
Figure 3.4. Chartbeat dashboard showing real-time traffic data from gizmodo.com (screenshot
taken on 20 Jan. 2016). Notice e.g. the inclusion of a recirculation rate for how many users go from one piece of
content on the site to another rather than just leave.

  • About Us
  • About Us
  • Contact Us
  • Resources
  • Terms & Conditions
  • Media Coverage

License © 2023 Reuters Institute for the Study of Journalism