

The growth of social media and other aggregators over the last few years has changed the nature of online consumption and discovery. More consumers are now incidentally exposed to content via algorithmically driven feeds or recommendations on third-party platforms, while tech giants like Facebook (Instant Articles), Apple (News app), Google (Accelerated Mobile Pages), and Snapchat (Discover) have developed their own formats into which branded news content can be placed.
This shift towards distributed media has been widely documented in our Reuters Institute Digital News Report (see e.g. Newman et al. 2017). The majority of access to websites and apps is now via side-door routes (65%) rather than direct (32%)
In the context of the fake news debate, President Obama is just one of many to have pointed out that in distributed environments all news stories tend to look the same, making it hard to distinguish between reputable news brands and those peddling untruths. From a media company perspective, correct attribution is essential since these environments are often used for driving traffic back to owned websites or apps where content can be monetised. Many commentators are worried about the impact on journalistic business models of powerful platforms that increasingly control who publishes what, to whom, and how that publication is monetised (Bell 2016, Nielsen and Ganter 2017).
So who gets credit for content in distributed environments? Do people remember the news brand or does the platform get most of the value? When people say ‘I saw the story on Facebook’ do they even notice the brand or the journalist? Which news brands do best for recognition and why? These are some of the questions we have set out to answer in this short report that focuses on the situation in the United Kingdom.
In order to answer these questions we used a YouGov panel to automatically track website usage by a representative sample of UK internet users (desktop only) and then within 48 hours served a survey to a proportion of these users to see what they could remember about the story and the brand. This approach allows us to get reliable data on an area that (a) is measurable in a consistent way, (b) remains a significant part of publisher strategies, and (c) is of considerable interest to policy makers and other stakeholders interested in the dynamics of increasingly distributed news environments. It is important to note that this study only explores attribution for content that involves clicks to a news website and does not attempt to measure attribution of content that is consumed within third-party platforms (e.g. a headline or picture within a feed, a native video or branded instant articles or accelerated mobile pages – AMP). We recognise that this is an important part of the picture and a limitation of this study (as is the focus on desktop/laptop-only traffic). Still, we believe that a close focus on desktop usage where we can combine data on actual behaviour (through tracking) with data on recall (through our survey) presents a valuable insight into where and to what extent different users recognise and remember the brands that provide the news that they use, even when they have arrived at it via search engines or social media (rather than by going direct to the provider).
Key Findings
-
- Less than half could remember the name of the news brand for a particular story when coming from search or social media. Correct brand attribution was just 37% from search and 47% from social media. This compares with an attribution rate of 81% for users who arrived directly from another page on a destination website.
-
- By contrast, between half and two-thirds could remember the path through which they found the news story (social media 67%, search engines 57%). This reinforces the idea that platforms are getting more credit than publishers for the content they produce.
-
- Content produced by some news brands is remembered far more than that from others.When coming from social media, stories from the Guardian (69%), BuzzFeed (68%), and theBBC (59%) were correctly attributed around twice as often as stories from the Independent(35%), the Mirror (27%), or the Sun (29%). When coming from search, stories from the BBC (61%), the Guardian (58%), and the Telegraph (41%) were correctly attributed far more often than stories from the Express (20%), the Mirror (19%), or the Independent (19%).
-
- These differences can partly be explained by brand loyalty. Users were more likely to remember the brand via social media and search engines when they read a story from their main source of news. Indeed, differences between direct and distributed paths almost disappear when we look specifically at loyal users. Other important factors include the way in which the brand is expressed in third-party platforms – the way in which stylistic elements such as logos stand out, as well as a consistent tone.
-
- Another factor affecting attribution appears to be the type of content. When coming from social media, the news brand is remembered more when the topic is hard – politics(57%) and international news (46%) – but less for news which is more about lifestyle/ entertainment, such as sport (35%) and entertainment/celebrity news (31%).
-
- Correct brand attribution from content found in Facebook (44%) was significantly lower than Twitter (55%). This is likely to be because Twitter users are more engaged with and more interested in news (see Newman et al. 2017).
- Young people (18–24s) are almost twice as likely to correctly attribute a news brand when coming from social media compared with older groups (55+).
Methodology
For the purposes of this study, we tracked the news-browsing behaviour of UK desktop users from YouGov’s PULSE panel from 13 March to 10 April 2017. The panel contains 13,709 people with 6,811 active users, who have given permission for their activity to be tracked but not individually identified. By tracking computer browsing history, we observed their web journeys leading up to reading a specific news story on any of the most prominent UK news websites. A little later, we surveyed panellists who had read these news stories, and asked them questions about what they remembered about the brand and the path – as well as about their wider news habits. This means we can identify correct brand attribution (where we know from tracking that a user has actually accessed a story from a specific news brand, and in the survey correctly recalls the brand) and correct path attribution (where we know from tracking how a user arrived at a story and in the survey correctly recalls the path).
By employing this method, we go beyond an important recent study by the Pew Research Center on source recall that found that news brands are more likely to be remembered when accessed directly compared to other pathways (Mitchell et al. 2017). For their research, Pew surveyed users about their online news navigation up to two hours prior to the completion of the questionnaire. In this study, we can go beyond that because we are able to combine tracking of actual news-reading behaviour (through tracking) with survey findings to measure correct brand attributions (through recall) rather than rely purely on recall with no behavioural data for comparison.
The UK news sites selected for this study were based on the top 20 online sources in the Reuters Institute Digital News Report (Newman et al. 2017). We only surveyed people who had read a news story on one of these websites (excluding home pages and other index pages), and we only counted news stories that had been viewed for at least five seconds. The surveys were sent out from Monday to Friday, and respondents could respond between a minimum of 10 hours and a maximum of 48 hours after viewing the story. This resulted in three survey datasets: one with directly accessed news story clicks, one with news stories accessed via social media, and another one with news stories accessed via a search engine.
To identify the path they actually used to access a news story we did the following. If the user accessed a news story by being at the domain of the news website before, then the path was coded as Direct. This could be a home page, an index page, or another story page on the website. If the previous website domain was a search engine domain and the search query roughly matched the title of the news story, the path was coded as Search. If the previous website was Facebook or Twitter, then the path was coded as Social. More details about the identification of paths to news stories can be found in the Appendix. The survey started with a filter question asking respondents if they remember reading the news story: ‘Do you recall viewing a story with the headline X yesterday?’ Those that remembered reading the news story (95% of users), were then asked about the brand and the path they used: ‘Can you remember how you first came across the story yesterday?’ and ‘On which of the following news websites did you read this story? If you read it on more than one, please select all that apply’. By comparing these responses to our tracking data on actual behaviour, we classified each news story as having correct or false news brand and path attribution. Respondents could respond to the survey question more than once. In total, 1,609 UK adults responded to 3,128 surveys about their clicks to news stories. We placed quotas of 1,000 completed surveys for each path of interest. The brands were the following: BBC; BuzzFeed; Channel 4; Daily Mail; Huffington Post; Mirror; Sky News; Daily Telegraph; Sun; The Times; Yahoo; Independent; ITV; The Lad Bible; Breitbart; The Canary; Metro; Daily Express; London Evening Standard; Guardian; MSN. A fifth (21%) of the respondents responded once in the survey, while the maximum was six times (1% of respondents).
The analysis that follows is made at the click-level and not at the respondent-level since the respondents answering more than one survey were also accessing via different paths. Finally, YouGov conducted a content analysis of the 3,128 news stories that were part of our survey. The news stories were coded for topic (e.g. political news story, entertainment news story, business story, etc.) and news story type (e.g. news article, opinion piece, explainer). More information about the survey questions, the content analysis, the weighting, and how the paths to news stories were coded can be found in the Appendix.
News Brand Attribution Findings
Overall, we find striking differences for correct news brand attribution between the three different paths of access. Out of news stories accessed directly, 81% could correctly attribute the news brand that produced the story (based on 1,098 completed surveys). The same number for accessing news via search (1,022 surveys) was 37% and for access via social media (1,008 surveys) was 47%. In news journeys via Facebook (795 completed surveys), the number of correct brand attributions was 44%, while for Twitter (194 surveys) the share of correct brand attributions was 55%. This higher level of attribution in Twitter can partly be explained by data that show Twitter users think it is a more useful way of finding news (60% in the UK) than Facebook (28%) and tend to be more interested in news than most people (Newman et al. 2017).
Overall, these findings suggest that people remember the source they used when getting news via side-door access less than half of the time. On the vast majority of occasions with non-correct attributions from all three paths, respondents chose the ‘I can’t remember’ option, followed by the BBC (12% in news accessed via social media).
Regular users more likely to correctly remember the news brand
While it may be tempting to blame the high level of competition and low level of branding in third-party platforms, it is striking that differences in brand attribution are almost wiped out when we take into account whether users are already regular users of that news brand. For those who were exposed to a news story from their main source of news, correct brand attributions are 92% for those who access news directly, 72% for those who accessed news via a search engine, and 80% for those who accessed news via social media. The differences are striking, with main users of a particular brand being 35 percentage points more likely to correctly attribute than all users when coming from search and 33 points more likely when coming from social media. This suggests that low attribution in distributed platforms could be more closely related to weak levels of pre-existing engagement than the impact of the platform itself. Having said that, it could be argued that the weakness of many existing publisher relationships with consumers is partly a consequence of the shift to the discovery of content via third parties and the amount of time spent with platforms like Facebook.
Top brands have higher levels of attribution
If we look at correct brand attributions for the three brands with the most news journeys during the period of our study (the BBC, the Guardian, and the Mail) we find significant differences by outlet. All three have high direct attributions, while the BBC and the Guardian have relatively high correct brand attributions via search (61% and 58%) compared to the Mail (39%). The Guardian had the highest correct brand attributions (69%) from the social media path, more than ten points ahead of the BBC (59%) and more than 20 points ahead of the Mail (44%). Again, these differences may be partly related to loyalty and usage. The Guardian and the BBC are more active on social media (and in many cases have more fans and followers4) than the Mail Online, which is used more by older groups who tend to visit directly or via email.
More loyalty helps attribution
For these brands, we also see that those who use them as main brands were much more likely to correctly remember the brand for a particular news story even if they were using a side-door path to news (search engines and social media). For the BBC, this is most significant for those accessing a story from social media where we see a 26 percentage point difference (82% of correct brand attributions, n = 80). In the case of the Guardian, the biggest difference comes from search, where there is a 23 percentage point gap between those who use the Guardian as main brand, and all readers of the Guardian (78% correct brand attributions from search among loyal Guardian users, n = 46). Again, this suggests the more familiar a user is with the tone, the content, and the style of a particular brand, the more likely they are to pick it out in a social media feed or in the list of search results. This is in line with previous research which has highlighted the importance of source cues for how people navigate news online (Messing and Westwood 2014), but also underlines that not all brands are equally strong cues.
Brand attribution scores via search
In the next chart, we set out the attribution scores from the search path for major UK news brands. We see relatively high levels of correct attribution for the three most popular UK brands (the BBC, the Guardian, and the Mail), but much lower scores for a range of other publications including top UK tabloids and the digital-only Independent. In general, there is a strong correlation between general online usage (as measured by surveys like the Digital News Report or industry tools such as ComScore) and correct attribution, so we can assume that familiarity is an important factor. It is worth highlighting that we find relatively strong levels of attribution for the Daily Telegraph (41%), which has historically placed a great deal of emphasis on search engine optimisation and in writing content specifically aimed at answering search queries. It is plausible that regular search users who find valuable content this way from the Telegraph remember and credit the brand over time.
Brand attribution from social media
Once again, some of the highest levels of correct attribution relate to the most used online brands, with the Guardian ahead (69%) followed by the BBC (59%) and the Mail (44%). The main difference is the presence of BuzzFeed as the second most recognised brand at 68%. In one sense this is not surprising; BuzzFeed has built its reputation producing distinctive content that is designed specifically for Facebook and other distributed platforms. Its strong branding (icons, colours, and emojis) and content formats (videos, quizzes, and lists) have enabled the brand to be well recognised, especially with its target under-35 demographic. By contrast, in the long tail of outlets correct brand attribution via social media is low in tabloids (Mirror, Sun) where the type of news stories covered – and the tone – is often similar to other outlets. Overall, we can observe that brands that are well remembered, even from social media, are not necessarily the ones that are related to partisanship but also the ones that are distinctive in their style and tone.
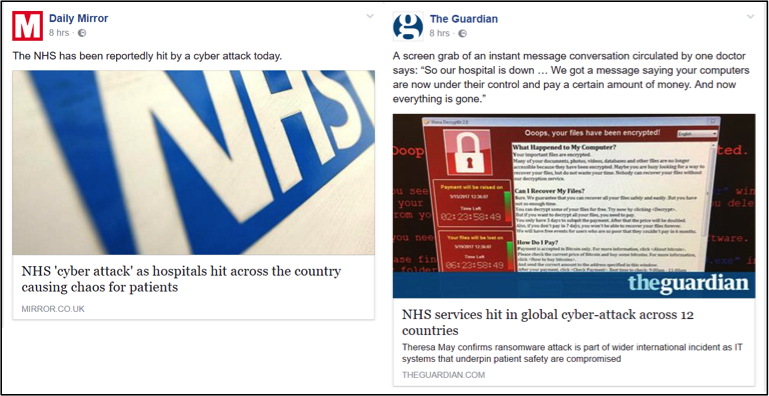
Apart from the distinctiveness of the content itself, the way news is presented in social media is another possible explanation of the differences in news brand attribution. Immediately after the NHS cyber-attack in May 2017, Daily Mirror (27% of correct brand attributions from news stories accessed via social media) posted a link of the story on Facebook with a generic text accompanying it with an image of the NHS logo. Contrast this with a post from the Guardian (69% of correct brand attributions from news stories accessed via social media), which provided more explanatory text along with a more compelling image. The Guardian also ‘burnt in’ a logo on the image to provide extra branding. These differences enabled the Guardian’s post to take up more space in the news feed than the equivalent post from the Mirror.
How does reading time impact attribution?
In the survey, as well as asking about brand recognition, we asked how much of the story they had read. Half of respondents (51%) said they read the entire story, with a quarter (26%) reading part of the story, and the remainder (22%) just looking at the headline or a few lines. For users accessing directly, it did not seem to matter much how much of the story was read, but there were bigger differences from distributed paths. Users who read just the headline or a few lines were not likely to remember the brand when accessing via search (22% correct brand attributions) or social media (30% correct brand attributions). It makes sense that greater engagement leads to greater recognition for the news brand and that the jump is bigger from search and social because users are (on average) less invested in any particular brand in the first place. If people find content worth their while, they are far more likely to remember who produced it.
Age makes a difference in brand attribution from third-party sites
When it comes to age in brand attributions, there were few differences when the news was accessed directly. However, as seen in the next chart those under 35 were much better able to remember the brand where they read news story coming from social media and search engines rather than those over 35. From Digital News Report data we know that more young people use
social media as a main source of news, compared to older ones who use it a secondary source, which may explain these disparities (Newman et al. 2017). In addition, these results could be explained by the fact that young people are more active social media users than older social media users (Dutton et al. 2013), with higher levels of digital literacy.
Attribution by Topic and Story Type
To gain further insights, we coded the stories we surveyed by news topic (e.g. political, business, entertainment news, etc.) and content type (news articles, opinion pieces, explainers, etc.). This was done to identify if these factors influenced levels of correct attribution. The coding was done manually and news stories could be coded for more than one topic or type. The list of codes can be found in the Appendix.
Attribution by news topic
As in the next chart, when news stories were accessed via social media, people were more likely to remember the brand they used to read/watch political news (57%), as well as local (47%) and international news (46%). Surprisingly, ‘weird’ news that includes funny and bizarre stories has a high news brand attribution (56%). More broadly, stories with soft news topics like sports and entertainment news had lower brand attribution.
There are a number of possible explanations for these differences. The source of political news or local/international news that deals with contentious issues might be considered more important by users, because of perceived bias by a particular news brand. Celebrity and lifestyle news or sports news is unlikely to be affected by these considerations and this type of news tends to be less distinctive than political coverage. The high recognition for weird news may relate to high recognition for BuzzFeed, which was the source of many of these stories.
The role of story type
Apart from the topic of news, we also coded a number of different story types of formats: (1) news articles which made up the majority of stories consumed, (2) opinion piece or columns by named journalists or bloggers, (3) lists (e.g. 10 places you need to visit), (4) live blogs/live page which is a popular way of covering a breaking or developing story, (5) explainer stories that aim to help the audience answer specific questions or explore background to a particular issue, and (6) video stories (without accompanying text). For the purpose of this analysis we are only able to look at the three most popular types (news articles, opinion pieces, and explainers) due to low sample sizes with the other formats. We have combined the social and search paths to create samples of between 100 and 1,600 for each format. Overall, we find that opinion pieces have a higher level of correct attribution (59%) from social media and search (based on 92 completed surveys) compared to news stories (42% correct attributions based on 1,491 surveys) and explainer stories (27% correct attribution from 215 surveys). The vast majority of explainer stories were found in search, and in this they had brand recognition of just 24% (182 surveys).
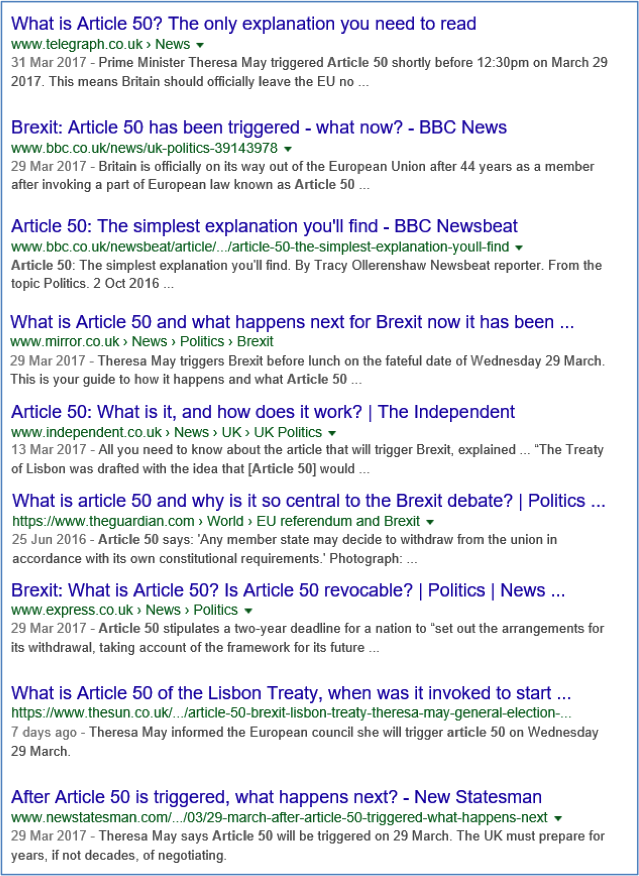
One can assume that opinion stories may benefit from being about hard news topics that, as we have already seen, tend to achieve higher brand recognition. Explainers that often try to answer questions from users looking for specific information have become a particularly popular format as a way of gaining traffic from search optimisation. This can lead to similar and formulaic output. One example can be seen when conducting a Google search about a complex current affairs issue in the UK (the triggering of Article 50). Findings from news sites in the resulting pages show a list of almost identical headlines from a wide range of UK news outlets. If it is hard to distinguish between the headlines and the snippets, it is perhaps not surprising that the brand is less identifiable.
Path Attribution
In addition to asking about the brand, we asked whether users remembered their path to the news story. Here we find that it is the platform rather than the publisher that takes the greater share of the credit. While brand recognition in search and social is under half, path attribution is well over half for search (57%) and over two-thirds for social (67%). Within the social media path, correct recognition for Facebook is higher (70%) than for Twitter (60%) perhaps because of a familiarity that comes from greater levels of usage and time spent in general (Newman et al. 2017/ComScore).
Conclusions
This unique study, combining tracking and survey methodologies, has cast new light on whether news brands are – or are not – recognised when coming from search and social media. We also found that brand loyalty plays an important role in correct attribution via search engines and social media, but also highlights other ways in which brands can stand out – through distinctive content, strong visual branding, and a consistent tone. Familiarity with brands such as the BBC, the Guardian, and the Mail Online combined with the value already placed on them by users is helping them stand out in distributed environments such as social media and search – driving traffic and credit in a virtuous circle. Interestingly, the three brands that stand out here are very different – the BBC strives for impartiality, for example, while the Guardian and the Mail Online are proudly and unapologetically partisan. There are clearly several different ways to a strong brand with higher attribution. By contrast, we have seen how other national brands, which are less used online or have less distinctive content, such as the UK tabloids and digital-only brands like the Huffington Post and the Independent have lower levels of recognition. Their brands are less visible in distributed environments just as their business is becoming more dependent on third-party platforms.
In the case of BuzzFeed, we do find a brand that has managed to achieve significant recognition in social media due to strong visual branding (colours, logos, and emojis), a consistent tone and distinctive formats (lists, quizzes, etc.). The Guardian too has developed a clear visual language for distributed environments including heavy additional branding of assets such as videos and images.
There is a clear lesson for other publishers here. Visibility in social media and search is critical to brand recognition, which in turn is critical for eventual monetisation – whether that be subscription or via attracting premium advertising. Visibility can be influenced by stronger branding and more distinctive content, but this may be hard to achieve without a strong base of regular users to a destination website or app. The finding that people are more likely to remember the platform where they found the content (e.g. Facebook), rather than the news brand that created the content, will be troubling for many publishers. Some weaker brands may be forced to re-evaluate the use of these platforms for marketing – or click-through – and develop alternative approaches. Others may be reassured that their strong brands do already cut through in a distributed world, giving greater confidence in future negotiations with platforms around existing and new models.
Appendix
Tracking different paths
To compare correct brand attributions by different paths, we looked at the page users visited before reading a news story.
(a) Direct: If a news domain name was the same as their previous page domain, the path was considered direct (this includes instances where the previous domain is the homepage). We included a check that the page was not simply a refresh.
(b) Search: Looking at the domain name of the page immediately visited before the news page, we checked against a list of google.co.uk, google.com (and other Google varieties such as Google Germany, Netherlands, Ireland, Poland that take up a tiny fraction). We did not include Yahoo search for the survey sample, but these searches made up no more than 1% of search traffic. To further refine the searches, we removed those that referred to Google maps, Google finance, Google bookmarks, or a full URL in the search (instead of a set of key words). To make sure that the news page visited was relevant to the search we examined
whether the search term was included in the news story headline. We also explicitly filtered those remaining search path URLs that contained the substring ‘q=’ and extracted the query string itself. This allowed us to remove stop words such as ‘is’, ‘the’, ‘and’ (etc.) from the query list, to refine checks on whether search terms appeared in the headline.
c) Social: The path was considered social if looking at the domain name of the page immediately visited before the news page included a social site or a short version (facebook.com; twitter.com; l.facebook.com; #facebook.com; t.co; bbc.in; bzfd.it; dailym.ai; trib.al). As the short versions can come from any social media platform, we checked the second page back before the news page to see if they came from Facebook or Twitter.
The users had to remain for at least five seconds in each news story in order to be surveyed. We only surveyed users on their first visit on a news URL to avoid instances of a user switching back through an old ‘already read’ tab that would distort the pathway to news story. We surveyed users until we had 1,000 completed survey responses from each of these paths. The response rate was 66% for survey dataset of news stories accessed directly, 58% for the dataset of news stories from search engines, and 60% for the dataset of news stories from social media.
Survey questionnaire
The questions were the following:
1. A filter question asking users whether they remember reading a story with the headline of the story. (About 5% of users were filtered out because they did not remember reading the story.
2. A question about the path they have used: Can you remember how you first came across the story?
3. A question about the news brand they used: On which of the following news websites did you read this story? Users could pick a website from a list of UK news websites as well as Other and Do not know/Can’t remember.
4. A question about how much of the news story (or video) did they read (or watch).
5. A question about which online news source is their main news source of news.
6. A question about which path to news is their usual path of accessing news.
7. A question about interest in news.
We then further coded each response as correct or false news brand and path attribution, if the response matched the tracking history.
Content Analysis
All the news stories were coded for topic and news story type. For the coding of topic, a news story could be coded as being related to (1) international news, (2) political news, (3) local news, (4) business and economic news, (5) entertainment and celebrity news, (6) lifestyle news (e.g. food, fashion, travel, cooking, wellness), (7) health news, (8) education news, (9) arts and culture news, (10) sports news, (11) science and technology news, (12) news about crime, justice, and security, (13) weird news (e.g. funny, bizarre, quirky news), and (14) other. A news story could have more than one topic. For instance, a news story about the President of the US would be coded as both an international and a political news story. The coding for story type was the following: (1) news article, (2) opinion article/column, (3) list (e.g. 10 places you need to visit), (4) live blogging/live story, (5) explainer story or question answerer, (6) video news (no text, just a video).
Weights
The findings were weighted to match UK adult desktop population targets on age and gender. The weight efficiency is high (88%) and it means that the weights did not have to heavily up-weigh or down-weigh any panellists. The minimum weight factor is 0.6 and the maximum is 2.3. Good efficiency is due to the diligent recruitment process, where YouGov monitors the age and gender
quotas of participants. Hence, the weighting only implements minor corrections.
About the Authors
Dr Antonis Kalogeropoulos is a Research Fellow at the Reuters Institute for the Study of Journalism. His doctoral work was focused on the effects of exposure to economic news. His research interests include political communication, journalism, and audience research.
Nic Newman is a journalist and digital strategist who played a key role in shaping the BBC’s internet services over more than a decade. Nic is currently a Research Associate at the Reuters Institute and is also a consultant on digital media, working actively with news companies on product, audience, and business strategies for digital transition.
Acknowledgements
The authors are particularly grateful to the team of data scientists and researchers at YouGov for flexibly accommodating our research design and adapting and iterating their systems to meet requirements. We are particularly grateful to Padraig Cleary for his painstaking work on checking and iterating the data capture in the light of feedback and to Mark Jefford and Charlotte Clifford for their analysis and insights, much of which has been incorporated into this publication. We would also like to thank the research team at the Reuters Institute for their advice on the research design and feedback on the implementation – in particular Richard Fletcher, Benjamin Toff, and Rasmus Nielsen.
Published by the Reuters Institute for the Study of Journalism with the support of Google and the Digital News Initiative.