
This year’s report comes amid intense soul-searching in the news industry about fake news, failing business models, and the power of platforms. And yet our research casts new and surprising light on some of the prevailing narratives around these issues.
- The internet and social media may have exacerbated low trust and ‘fake news’, but we find that in many countries the underlying drivers of mistrust are as much to do with deep-rooted political polarisation and perceived mainstream media bias.
- Echo chambers and filter bubbles are undoubtedly real for some, but we also find that – on average – users of social media, aggregators, and search engines experience more diversity than non-users.
With data covering more than 30 countries and five continents, this research is a reminder that the digital revolution is full of contradictions and exceptions. Countries started in different places, and are not moving at the same pace. These differences are captured in individual country pages that can be found towards the end of this report. They contain critical industry context written by experts – as well as key charts and data points.
Some of the key findings from our 2017 research:
- Growth in social media for news is flattening out in some markets, as messaging apps that are (a) more private and (b) tend not to filter content algorithmically are becoming more popular. The use of WhatsApp for news is starting to rival Facebook in a number of markets including Malaysia (51%), Brazil (46%), and Spain (32%).
- Only a quarter (24%) of our respondents think social media do a good job in separating fact from fiction, compared to 40% for the news media. Our qualitative data suggest that users feel the combination of a lack of rules and viral algorithms are encouraging low quality and ‘fake news’ to spread quickly.
- There are wide variations in trust across our 36 countries. The proportion that says they trust the news is highest in Finland (62%), but lowest in Greece and South Korea (23%).
- In most countries, we find a strong connection between distrust in the media and perceived political bias. This is particularly true in countries with high levels of political polarisation like the United States, Italy, and Hungary.
- Almost a third of our sample (29%) say they often or sometimes avoid the news. For many, this is because it can have a negative effect on mood. For others, it is because they can’t rely on news to be true.
- Mobile marches on, outstripping computer access for news in an increasing number of countries. Mobile news notifications have grown significantly in the last year, especially in the US (+8 percentage points), South Korea (+7), and Australia (+4), becoming an important new route to content and giving a new lease of life to news apps.
- In a related development there has been a significant growth in mobile news aggregators, notably Apple News, but also Snapchat Discover for younger audiences. Both have doubled usage with their target groups in the last year.
- Smartphones are now as important for news inside the home as outside. More smartphone users now access news in bed (46%) than use the device when commuting to work.
- Voice-activated digital assistants like the Amazon Echo are emerging as a new platform for news, already outstripping smart watches in the US, UK, and Germany.
- In terms of online news subscriptions, we have seen a very substantial ‘Trump bump’ in the US (from 9 to 16%) along with a tripling of news donations. Most of those new payments have come from the young – a powerful corrective to the idea that young people are not prepared to pay for online media, let alone news.
- Across all countries, only around one in ten (13%) pay for online news but some regions (Nordics) are doing much better than others (Southern Europe and much of Asia).
- Ad-blocking growth has stalled on desktop (21%) and remains low on smartphones (7%). Over half say they have temporarily disabled their ad-blocker for news in countries like Poland (57%), Denmark (57%), and the United States (52%).
- We have new evidence that news brands may be struggling to cut through on distributed platforms. In a study tracking more than 1,500 respondents in the UK, we found that while most could remember the path through which they found a news story (Facebook, Google, etc.), less than half could recall the name of the news brand itself when coming from search (37%) and social (47%).
- Austrians and Swiss are most wedded to printed newspapers, Germans and Italians love TV bulletins, while Latin Americans get more news via social media and chat apps than other parts of the world.
Our Changing Media Mix
We now have six years’ data looking at the sources people use for news.1 In most countries we see a consistent pattern, with television news and online news the most frequently accessed, while readership of printed newspapers has declined significantly.
The biggest change has been the growth of news accessed via social media sites like Facebook and Twitter. In the United States, social media became a key player in the story of the election not least because of its well-documented role in spreading made-up news stories, such as that Pope Francis endorsed Donald Trump or that Hillary Clinton sold weapons to ISIS. Over half (51%) of our US sample now get news via social media – up five percentage points on last year and twice as many as accessed in 2013.
It would be misleading to overplay the role of social media in Donald Trump’s victory. In general, a far bigger proportion of Americans still get their news from television and online sources, which also benefited from strong interest in the election race. Even those relying more on social media would have found much of the news in their feed came from traditional media outlets.
The reality is that, for most of us, social media are not something different but increasingly just part of the everyday media mix. Two-thirds of social media news users in the United States also watch television news (67%) and two-thirds also visit mainstream websites or apps (66%) – a bit more than the the general population. Just 2% ONLY use social media for news in an average week. This evidence acts as counter to the often-cited theories that we live in our echo chambers much of the time. Most people combine a number of different sources and platforms for news.
We should also remember that there are significant generational splits in the sources used for news. Across all countries, younger groups are much more likely to use social media and digital media as their main source of news, while older groups cling to the habits they grew up with (TV, radio, and print). A third of 18–24s (33%) now say social media are their main source of news – that’s more than online news sites (31%) and more than TV news and printed newspapers put together (29%).
Social Media Growth Slows Down, Messaging Up
It is striking that, outside the United States and United Kingdom, growth in the use of social media for news seems to be flattening out. In most countries growth has stopped and we have seen significant declines in Portugal (-4), Italy (-5), Australia (-6), and Brazil (-6).
This may just be a sign of market saturation, or it may relate to changes in Facebook algorithms in 2016, which prioritised friends and family communication over professional news content. The UK and US may have been exceptions because the heated nature of the election and referendum debates were significantly played out through social media. Another explanation for any wider slowdown could be that people are spending less time with social networks and more time with messaging applications.
The Rise of Messaging Applications for News
Overall around a quarter (23%) of our respondents now find, share, or discuss news using one or more messaging applications. We’ve been tracking the growth of WhatsApp for some time but its use for news has jumped significantly in the last year to 15%, with considerable country-based variation. Over half of our sample in Malaysia (51%) says they have used the app for sharing or discussing news in a given week, but just 3% in the United States. Viber is a popular choice in parts of Southern and Eastern Europe, while a range of chat applications are used for news across Asia, including WeChat in Hong Kong (14%) and Malaysia (13%), Line in Taiwan (45%) and Japan (13%), while home-grown Kakao Talk (39%) is the top messaging app in South Korea.
The bulk of messaging use for news is currently happening in Asia and Latin America, but more closed and private messaging also allows users to share without fear of embarrassment – sharing significantly more photos than on more open networks like Facebook. Price is also a factor, with free WhatsApp use often bundled in with phone contracts. Many of these apps also offer encryption, which is particularly relevant for communication in markets where it can be dangerous to share politically sensitive information. This is true in Hong Kong where WhatsApp, We Chat, and Facebook Messenger are popular and in Turkey where a quarter of our sample (25%) share news via WhatsApp.
Historically news brands have struggled to distribute news through these private spaces, because content is delivered directly between peers. Few chat apps offered company profile pages or push-advertising as a way of marking them out from increasingly commercial social networks. But in recent years that has begun to change as they have started to become platforms in their own right. Over 30,000 bots (services that are programmed to have conversations around news, sport, or weather) have been created on the Facebook Messenger platform since launch in April 2016. WeChat, Line, Kik, and Telgram offer similar opportunities for users to subscribe to these branded services. CNN, Politbot (Spain), The Economist and the Guardian are amongst those to experiment with these new forms of conversational journalism.
Facebook Dominates Both Social Networks and Messaging
The growth of messaging comes as an extra layer on top of social networking rather than as a replacement. The vast majority (78%) of those using a messaging application for news ALSO use at least one social network for news. More generally about a third of our sample (32%) use two or more social networks or messaging apps in a given week.
These trends towards multiple networks are unlikely to worry Facebook. The company owns WhatsApp and Messenger, the two most popular messaging apps, along with Instagram, which has been incorporating many of Snapchat’s most popular features. Eight in ten (80%) touch a Facebook product weekly for any purpose, while over half of our sample (54%) uses one for news. Alongside Google, the company has acquired and is maintaining enormous power over the discovery and distribution of content.
Other Forms of News Aggregation Pick up Momentum
While exposure to news in social media is often incidental, the past few years have seen the growth of aggregation services that are more of a destination for news.
On a mobile phone in particular, where it can be difficult to move quickly between multiple apps and websites, the convenience of a one-stop-shop can be compelling. Sometimes these news aggregations are stand-alone products (Flipboard, SmartNews), at other times they are part of a wider service (Apple News, Google News, Snapchat Discover, Kakao Channel, and Line News). This second group – that are both destinations in their own right and allow content to hook into established eco-systems – are currently showing the strongest growth in our data.
Apple News has been one of the biggest gainers over the past year following the release of the Spotlight news feed and the ability to subscribe to rich-media mobile alerts for favourite publishers. These two features together seem to have supercharged usage, with a number of publishers telling us that up to a third of their mobile traffic now comes from the app or the related Spotlight news widget. The Apple News app is only available in the US, UK, and Australia, where our survey data suggest it is used by around a quarter of iPhone users,2 but the Spotlight feature is available in many more countries.
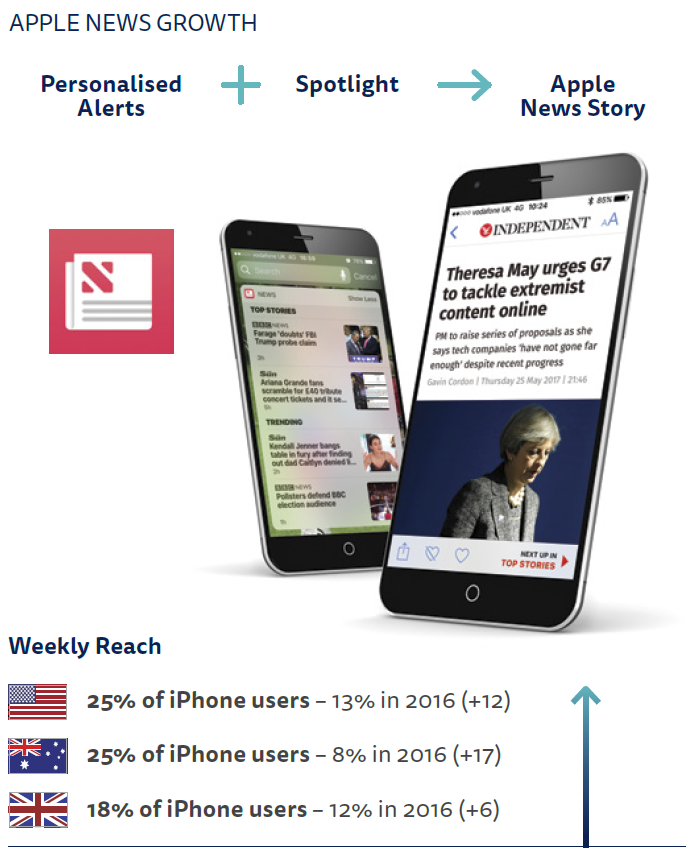
Base: Apple iPhone users: USA = 748, Australia = 708, UK = 660.
Google News has also improved mobile integration with the main Google search index through a series of branded carousels – part of its wider Accelerated Mobile Pages (AMP) initiative. The resulting pages are hosted by Google partly to ensure fast downloads but – as with Apple News – the branding is managed by the publishers themselves. Some participating news brands report a significant proportion of mobile traffic now coming from AMP pages.
Google News is widely used across markets, while other aggregators are strong in particular regions. Reddit has always struggled to expand beyond the United States (7%) and is little used in Europe. SmartNews and a range of other mobile aggregators are widely used in parts of Asia, reaching 11% of Japanese respondents.
Another story of growth comes from Snapchat’s Discover portal, which offers publishers like Le Monde, CNN and the Wall Street Journal the opportunity to reach a younger audience. Snapchat Discover has been available in the US, UK, and Australia, with the first non-English speaking versions rolling out in France in September 2016, and Norway and Germany in early 2017. Our data show increased traffic over the past year amongst the much-prized 18–24s target audience. This has been driven by more prominent placement in the app and allowing users to subscribe directly to Discover content from individual publishers.
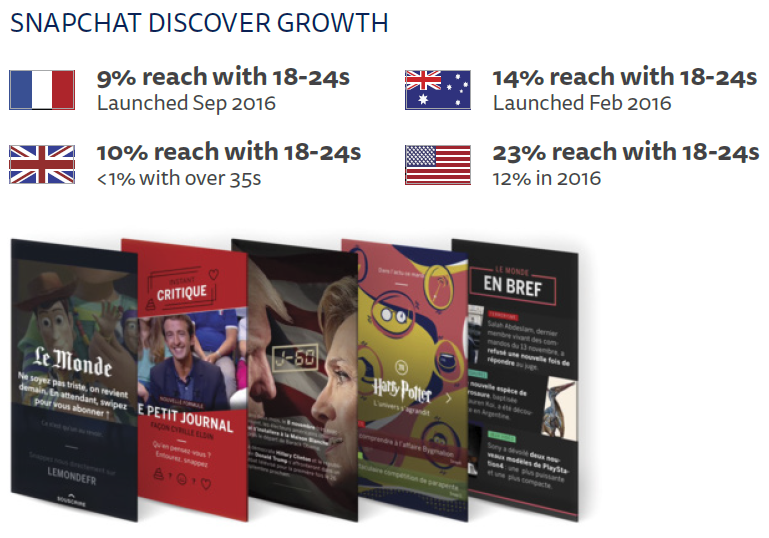
Base: Total sample in each country.
How the Mix of Gateways to News is Shifting …
Despite the rise of aggregators, social media and search remain the most important gateways to online content, alongside traffic coming to their own websites and apps.
Looking at preferred ways of getting to content across our entire 70,000 sample we see that destination websites and apps (direct access) remain slightly ahead of search and social. But if we add together preferences for all other routes, two-thirds of web users (65%) now prefer to use a side-door of some kind, rising to three-quarters (73%) for under-35s.
At the same time, we also find that behind these averages there are very different market-based preferences for how people discover and access news.
- People in Scandinavia and the UK are more likely to go directly to a website or app. Here strong commercial and public service brands have built and marketed powerful news destinations.
- By contrast social media are a hugely popular starting point in Latin America as well as some Central and Eastern European countries.
- Many Asian markets have a unique model where individual media brands are often subsumed within giant portals. Yahoo plays this role in Japan as do Naver and Daum in South Korea, where aggregators pay content providers an undisclosed amount (believed to be around $30m a year) for content published through their platforms.
- Email has made a comeback in many markets on the back of more personalised technology and mobile delivery. In Belgium more people (34%) access news via email than through social media. In the United States, where a quarter use email for news (23%), the charge has been led by new pure players like Quartz as well as the Washington Post, which offers around 70 newsletters as part of a strategy to drive both habit and subscription.
- Mobile alerts and notifications are most popular in Taiwan (32%) and Hong Kong (27%), as well as Sweden (22%). They have also grown strongly over the last year in the United States (20%) where publishers have been investing heavily in driving more content to the lockscreen.
More People are Discovering News through Algorithms than Editors
We can also add up preferences for content that is selected by an algorithm (search, social, and many aggregators) and compare with that selected by an editor (direct, email, and mobile notifications). More than half of us (54%) prefer paths that use algorithms to select stories rather than editors or journalists (44%). This effect is even more apparent for those who mainly use smartphones (58%) and for younger users (64%). As we discovered in last year’s focus groups, younger people tend to be more comfortable with algorithmic story selection, perhaps not surprisingly given their heavy use of social media.
The Implications of More Algorithmic Selection of Stories
A key question for policy makers is how this shift to discovering content though social media, search, and personalised aggregators is affecting the range and type of news we consume. Does it broaden or narrow our choices? Is it driving more extreme and polarised views? This year we have new evidence that, far from restricting content, algorithms are exposing most users to a greater range of online sources. Users of search, social media, and online aggregation services are significantly more likely to see sources they would not normally use (see chart).
This evidence is backed up by verbal comments from survey respondents across multiple countries, many of whom welcomed the wider diversity of sources available through digital media, especially through social networks.
There are different viewpoints and some things that the main media suppress in terms of political correctness.
Male (62), UK
Social media, search, and aggregators are all different in the range of views they offer and the way they are accessed. However, other respondents felt that exposure to more sources may not be driving the ‘right’ kind of plurality – especially if information comes from less reputable providers or ones that carry more extreme or partisan views.
Contradictory articles and trolling and conspiracy theory websites are everywhere and sow trouble.
Female, France
Too many people giving their version of things just leads to confusion for me.
Female (53), UK
The extent to which users can control and personalise these three environments varies considerably. Aggregators largely offer news from a selection of reputable news organisations while social media and search start with a universal canvas and filter down from there. This is where algorithms come in, though our research shows human overrides are a significant part of the picture. In social media almost half of our respondents (45%) have actively managed the content of their feeds by adding or removing users, with around a third (30%) fine-tuning content in other ways, such as hiding content from particular users. This activity allows users to protect themselves from views they don’t like, but it also opens up the possibility that they just end up seeing more of what they like.
Attribution in Distributed Environments
A second implication of the shift to distributed consumption through search, social, and aggregators relates to the level of attribution and recognition for news brands. In last year’s report our survey suggested that it is often the platform rather than the publisher that gets the credit for the news, while focus group respondents talked about how Twitter and Facebook had broken some of the most important stories.
Former President Barack Obama has been amongst those to observe that all news items tend to look the same in social media and search.3 ‘If we can’t discriminate between serious arguments and propaganda, then we have problems.’ He implies that the ‘flattening effect’ of social media in particular is bad for democracy in making it harder to identify reliable news sources.
This year, as part of our Digital News Report, we conducted a study where we passively tracked usage by a representative sample of UK users and then 3,000 surveys were completed to see what they could remember about the story and the brand. Overall, we found that roughly two-thirds remembered the path through which they found the news story (Facebook, Google, etc.), but less than half could recall the name of the news brand itself when coming from search (37%) and social (47%). Respondents were more likely to remember the brand if they had a previous connection with it or used it as a main source.
We Follow Politicians We Agree with on Social Media and Avoid Those We Don’t
This year we’ve looked in more detail at how many people follow politicians on social media, and the extent to which people only follow those with similar views to themselves. Donald Trump is just one of a number of prominent politicians looking to use Twitter and other networks to talk directly to supporters, as well as to control the media agenda.
In a sample of six countries (US, UK, Ireland, Germany, Spain, and Australia), we found that over a third of social media users (37%) followed at least one politician or political party. Across countries, people who do follow politicians are most likely to follow a politician or party of the left (20%), followed by the centre (16%), while those on the right tend to get less attention (12%). This difference can partly be explained by age, given that younger groups who use social media heavily tend to be left aligned. High levels of political following in the United States (54%) reflect over a decade of using digital and social media in political campaigning, but it is still striking that they are twice the levels seen in Germany (25%). We tend to follow politicians we agree with; respondents on the left are five times more likely to follow left-leaning politicians in social media than politicians from the right. The same is true in reverse in equal proportion.
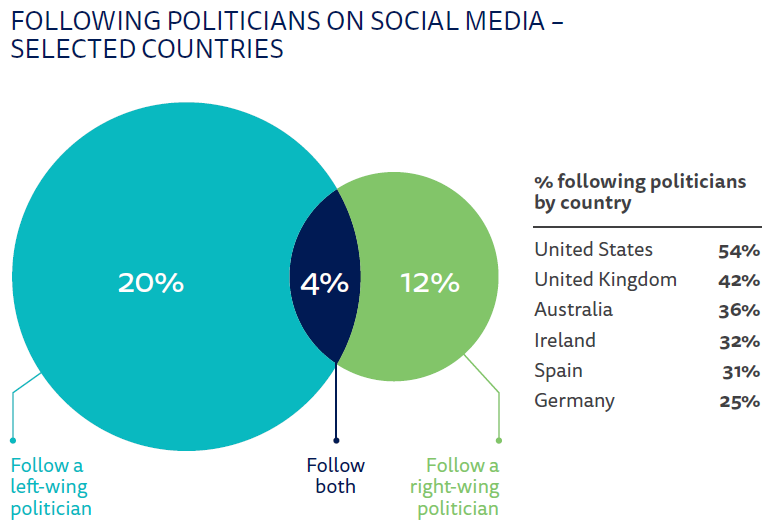
Base: Used social media for news in the last week: Selected countries = 7171.
Note. Figures are based on average of data from US, UK, Australia, Ireland, and Spain.
This suggests that following politicians in social media may be contributing to greater polarisation. On the other hand, we should remember that in a pre-digital age political activists would have spent a considerable amount of time with people who held similar views as well. What is different is the scale of this activity. Over half of social media users (54%) in the United States following politicians equates to around a third of the entire US online population.
Devices for News: Mobile Continues its Onward March
If social media are reaching saturation, the same is also true for smartphones – at least in developed markets. In most countries, weekly reach for news is at a similar level to last year or falling, although we have seen increases in the US (55%) and UK (49%).
But this doesn’t mean that the smartphone is becoming less important. Every year our dependence on these devices continues to grow. Taking the United States as an example we can see how, over time, far more people are using the smartphone as their MAIN device for news, while far fewer are relying on a desktop computer or laptop.
2017 marks the tipping point in the United States, United Kingdom, and Norway where smartphones have reached a par with computers in terms of news access, but other countries are at very different stages of development. In general, Asian and Nordic countries have moved furthest along the mobile-first path, with Central, Southern, and Eastern European countries still primarily using laptop or desktop computers to access news.
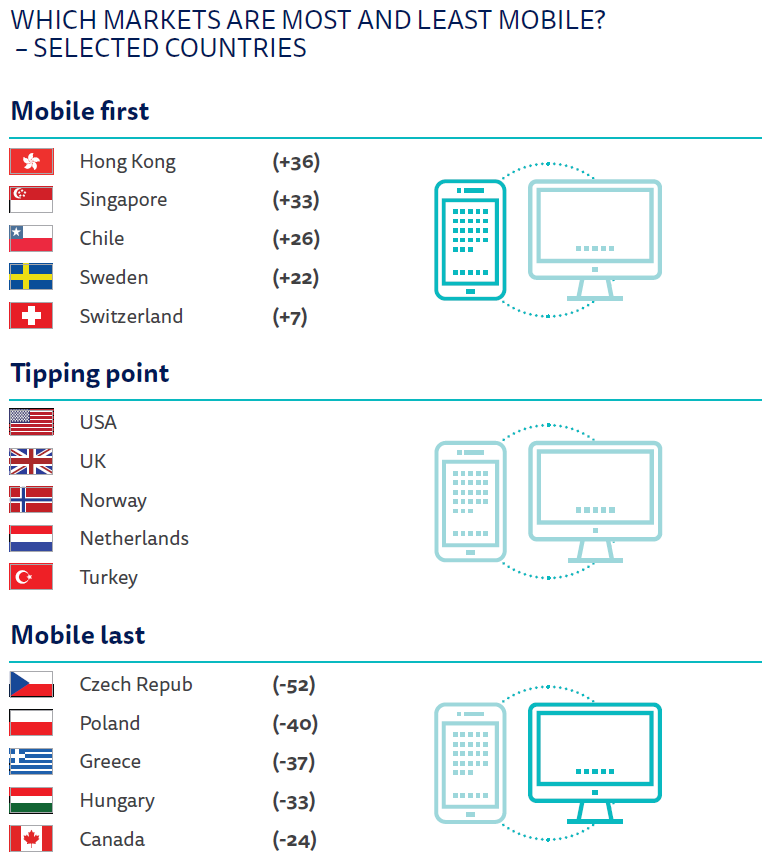
Base: Around 2000 in each market.
Note: Figures showing the percentage point difference between those using smartphone and computer as main news source.
While some are still making the transition from computer to smartphone, younger populations in our survey are essentially starting with a mobile screen. This is particularly the case in Latin America where a quarter of our respondents in Mexico (24%), and Chile (25%) ONLY use a smartphone for news in a given week. The same is true in Singapore (26%), Malaysia (27%), and Hong Kong (31%).
Another measure of the smartphone’s hold over our lives is that, in the UK and several other countries, the average number of devices used to access news weekly is falling. This makes little sense until we consider the changing way in which we are using our smartphones in the home. Over half (56%) use the device in personal spaces, up substantially from the figure two years ago. Almost half of smartphone users (46%) access news in bed and 32% read or watch news stories when they are in the bathroom or toilet. It is simply more convenient to pick up the device that is always with you, rather than seek out a computer or tablet in another room.
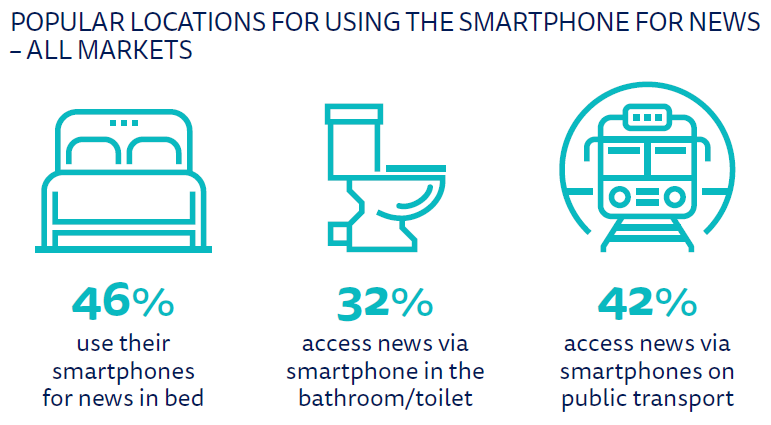
Base: All smartphone users = 53,670
News Apps Make a Comeback
As the smartphone extends its grip in the home, and becomes the central organising device of the digital age, it is worth reflecting on the implications for publishers.
As we have shown in previous years, smartphone users are much more likely to access via a side-door, increasing the importance of platforms such as social media. But our research this year suggests use of news apps may be making a comeback. After a period of little or no growth, we have seen a jump in the use of news apps in almost all countries. This is much more likely to be about more regular usage by existing app users, rather than by some surge in new installs. Two key factors are likely to be at play: (a) more publishers have enabled deep linking to apps from search, social, and email; (b) the substantial increase in mobile notifications noted earlier, as publishers pursue loyalty strategies and take advantage of new platform capabilities. It is no coincidence that the biggest increase in app use has come in counties that have seen the biggest increase in mobile notifications (US, Australia, South Korea).
Alexa, What’s the News?
For the first time this year we asked about the use of new voice-controlled digital assistants such as the Amazon Echo and Google Home. Until now, these have only been generally available in the United States as well as Germany and the United Kingdom (since 2016). A range of publishers such as CNN, the BBC, and Spiegel have created audio applications – such as news and weather summaries – specifically for these devices. Audio fact-checking services are also being developed. In the United States 4% of our sample use a voice-activated speaker – half of them for news. As these devices become more widely available, they could disrupt both the smartphone and the radio itself. They also help establish Amazon’s role as the fourth major platform player in the news market.
Video Not Everything it was Cracked up to Be?
After the product disruptions around auto-play video (2015) and live-social video (2016), consumption appears to have settled down into a more regular pattern. This year, instead of focusing on a headline figure, we have attempted to understand news consumption in three different environments: (a) feed-based social networks like Facebook and Twitter, (b) search-based platforms like YouTube, and (c) news websites and apps. We also categorised content as short-form (less than five minutes), long-form (more than five minutes), and live. The limitations of survey methodologies mean that these numbers will not be ‘precisely’ right, but they give us a broad overview of the type of content being consumed, as well as the location of that consumption, across all 70,000 respondents.
There are three key takeaways from these data. (1) Most video being consumed is short. (2) On every platform, around half of users don’t consume any online news video in a given week. (3) Only a minority of video is being consumed on news websites and this is particularly true for younger groups and in countries where social media are a bigger part of the media mix. As a format, video is already far more distributed than text.
Taken together, a number of these factors are making video harder to monetise. The biggest player, Facebook, currently does not offer any significant monetisation for anything under 90 seconds while on news websites current implementations of pre-roll ads are widely disliked by users, restricting consumption.
If I have thirty seconds to get actual news I don’t want to spend that thirty seconds going through an advertising video.
Focus group (20–34), USA
Both in focus groups and in our wider survey we asked respondents about this contentious issue. The largest group felt five seconds or less would be an acceptable exchange for valuable news content, with over two-thirds (69%) voting for ten seconds or less.
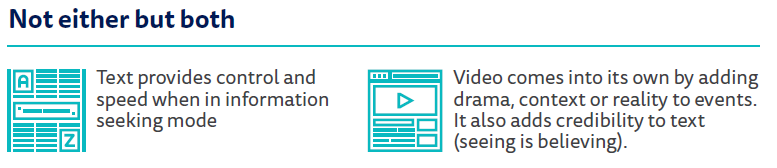
Despite greater exposure to online video news, we find that overall preferences have changed very little since we started tracking this issue four years ago. Across all markets over two-thirds (71%) say they mostly consume news in text, with 14% using text and video equally. This number has grown slightly in the United States but remains at under 10% in the UK and Nordic countries where more users get their online news direct from the provider. Importantly, there are no significant age differences; young people also overwhelmingly prefer text. Having said that, in focus groups and open responses, we do find that video is increasingly valued as part of a content mix, adding drama and context to important stories, to breaking news events such as the recent terror attacks in Paris, Nice, Manchester, and Brussels – as well as adding to the trustworthiness of content.
Base: Total sample in each country/all markets.
For the moment, publishers are stuck in a bind. They feel that they need to invest more in video because consumers increasingly expect to view as well as read news, but there is very little commercial reward for the most popular formats.
Fake News, Trust, and Political Polarisation
The widespread public debate over fake news and media bias has prompted us to look in detail at the issue of trust in the news media and in social media. Part of that has been to investigate a link with political polarisation and perceived media bias in a number of countries. We have explored these issues though our core survey, through analysing open-ended answers on trust from 10 countries and from our focus group activity in a smaller group of countries including the United States.4
Definitions of ‘fake news’ are fraught with difficulty and respondents frequently mix up three categories: (1) news that is ‘invented’ to make money or discredit others; (2) news that has a basis in fact, but is ‘spun’ to suit a particular agenda; and (3) news that people don’t feel comfortable about or don’t agree with.
In our analysis very few people can accurately recall having seen items in category 1, except in the United States. Indeed, respondents in Germany and France routinely use the English phrase ‘fake news’, suggesting that this is something that has been largely imported rather than a home-grown phenomenon. On the other hand, the issue of political bias and the limits of free expression are increasingly the subject of heated debate in many countries – even if social media may not be entirely to blame.
Our research suggests that the vast majority of news people consume still comes from mainstream media and that most of the reasons for distrust also relate to mainstream media.
Across all of our countries we see a similar pattern to last year, with trust highest in affluent Northern European and Scandinavian countries as well as Portugal and Brazil. Once again Central, Southern, and Eastern European countries tend to be at the other end of the scale, along with some Asian countries where media are considered to be too close to government. In Greece and South Korea less than a quarter of respondents (23%) agreed that you could trust the news most of the time.
In the United States the headline rate (38%) is up, although there is a 15-point gap between this and trust in the sources you use (53%). Only Hungary, another deeply polarised country, has a bigger gap between general trust (31%) and the sources you use (54%). To understand more about polarisation, we have mapped respondents’ political beliefs on a left–right spectrum and combined this with the sources of online news they use. The mid-point represents the mid-point of political opinion of our respondents; in the country in question the size of each bubble represents volume of consumption for each brand.5
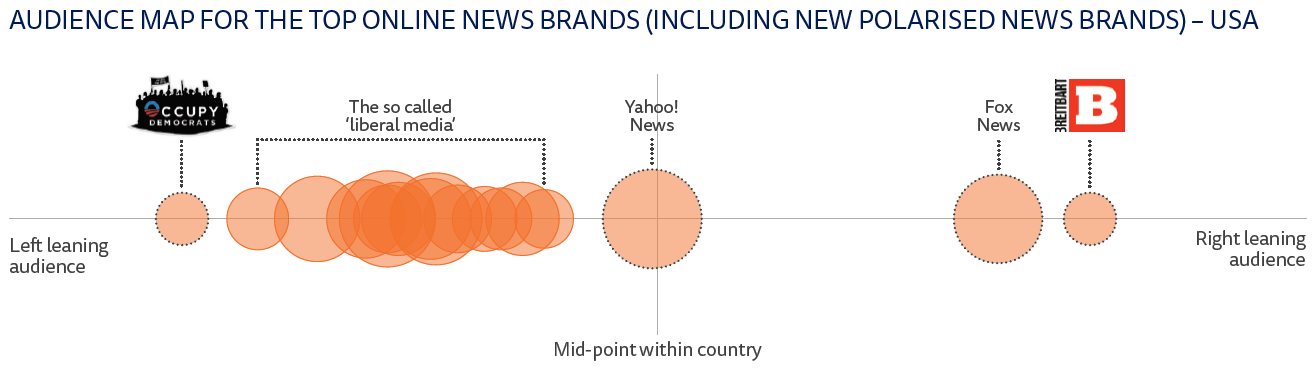
Q5b. Which of the following brands have you used to access news **online** in the last week? Please select all that apply.
Base: Total sample: USA = 2269.Note: Respondents who answered don’t know to Q1F were excluded.
This fascinating map shows a deeply polarised media landscape, which reflects an equally polarised society. The websites of TV networks like ABC, NBC, and CBC are used far more by people who self-identify as left-wing, along with the New York Times and Washington Post. By contrast the Fox News and Breitbart websites are mostly used by people with right-wing views. Arguably the gap on the right of this map has provided space for a range of hyper-partisan right-wing sites to emerge over the last few years. The map shows just online sites, but we should remember that polarisation also exists in the print and TV markets. Two-thirds of right-wingers watch the Fox News TV channel but only 11% of those who identify on the left. The hyper-partisan websites are even more split, with 19% of those on the right using Breitbart.com but only 2% on the left.
We can compare the US media and audience landscape with two very different European countries. The UK online map uses the same scale but shows less polarisation amongst the top online sources. A third of those who self-identify on the right on read the Mail Online, 14% in the centre, and 8% on the left. There are a few hyper-partisan sites (Breitbart and the Canary) but they attract much smaller audiences than in the United States. The BBC, which sits in the centre of our chart, is used relatively equally by those on the left, centre, and the right and provides a common set of facts with a combined online/offline weekly reach of 77%. Having said that, the polarising Brexit debate has increased distrust in the mainstream media generally from those on both ends of the debate, with the BBC particularly under fire.
Brexit and US presidency coverage proved beyond any doubt the utter left wing bias of the typical UK news media. I used to trust and value the BBC news but now it’s just a just a mouthpiece for the liberal leftists.
Male (52), UK
Even the BBC tends to support [a] far right winged party nowadays.
Female (54), UK
Overall trust has fallen seven percentage points in the last year.
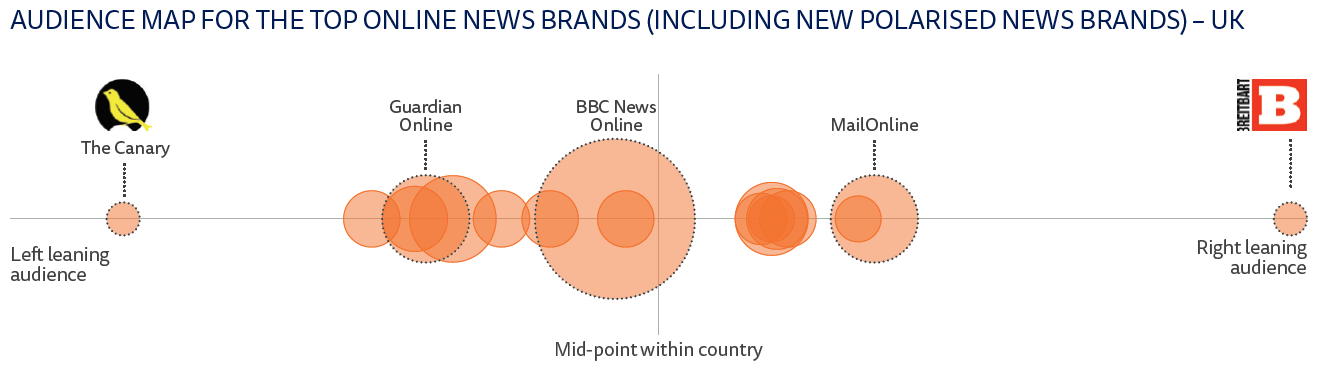
Q5b. Which of the following brands have you used to access news **online** in the last week? Please select all that apply.
Base: Total sample: UK = 2112.Note: Respondents who answered don’t know to Q1F were excluded.
Finally, we find a very different picture in Germany where all the media brands are clustered around the centre.6 The mainstream media in Germany is sometimes described as corporatist; not sufficiently challenging of the political and economic elites. During the immigration crisis of 2015 and 2016, right-wing groups revived a phrase from the Nazi era, Lügenpresse (lying press), to complain about suppression of debate and perceived left-wing bias. On the other hand this corporatist mix suits most Germans. Given the weight of history, most are wary of allowing extreme views to flourish in digital and social media.
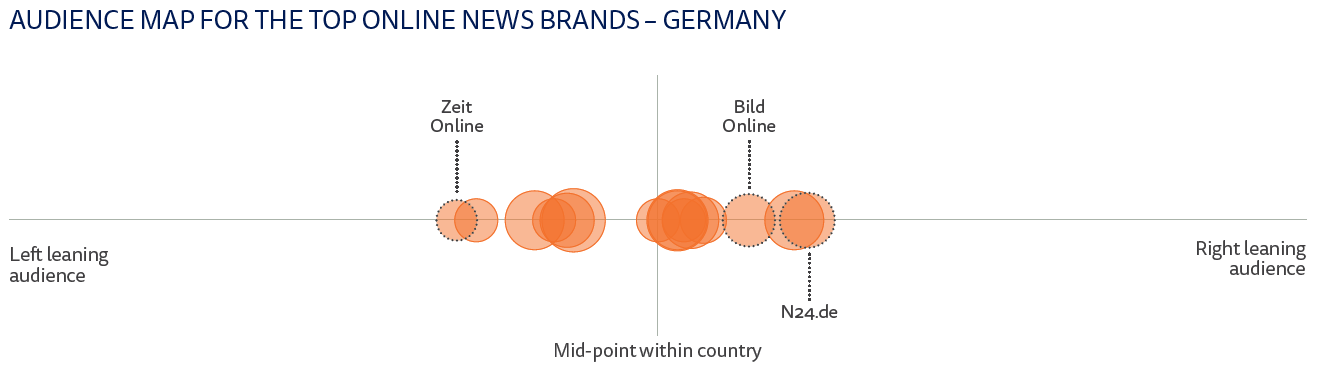
Q5b. Which of the following brands have you used to access news **online** in the last week? Please select all that apply.
Base: Total sample: Germany = 2062.
Note: Respondents who answered don’t know to Q1F were excluded.
Separating Fact from Fiction
In our survey we find a big difference between the news media and social media in their ability to separate fact from fiction. In countries like the US (38%/20%), Canada (51%/24%), and the UK (41%/18%), people are twice as likely to have faith in the news media. Only in Greece do more people trust social media (19%/28%) but this has more to do with the low opinion of the news media in general than the quality of information in their news feeds.
In analysing open-ended responses to these questions in ten countries we find a compelling link between distrust in the media and concerns about political bias, with over half the comments relating to this issue. In the United States, the vast majority of mistrust is generated from the right (Trump supporters and Republicans), because of the media’s perceived ‘liberal agenda’. In the UK, mistrust is more likely to come from the left, due to a sense that the right-wing press is pushing a pro-Brexit and pro-government agenda.
In terms of distrust in social media, many of the same themes emerge. There is a sense in some countries that feeds are being overwhelmed or polluted by different political agendas.
It’s a petri dish for ideological fake news.
Male (32), USA
There is no telling who is sharing what, and most titles are clickbait-y, so people share them without actually reading what the information is within the article.
Female (21), USA
Platforms like Facebook are increasingly trying to find answers to these problems by working with fact checkers to show when stories are disputed before they are shared. They are also looking to find ways of exposing users to content beyond their political bubbles through news related content experiments.7
Once again, however, it is dangerous to overstate these issues, which are seen as much less of a problem in many European countries and for younger respondents. For many of those who have configured their own feeds, social media can provide a convenient stream of reliable news, often exposing audiences to new perspectives.
You find information there that you can’t find on the major news channels. Certain sites (e.g. Demeure du Chaos) publish quite well-argued articles that are outside the box.
Male (59), France
For the most part, I think it’s easy to spot fake news. I’m not influenced by social media. I know how to weigh up the different sides of an argument.
Female (59), France.
The Value of Different Brands
Another important finding this year is that certain brands play a disproportionate role in creating trust and distributing common facts, particularly on serious issues like politics and international news.
For the first time we publish data about people’s perception of four key attributes of online news consumption: (1) accuracy and reliability, (2) helping with understanding complex issues, (3) communicating strong viewpoints and opinions, and (4) providing amusing and entertaining content.
Looking at the BBC in the UK, we can see that two-thirds of its users (70%) think it is ‘best for’ accurate and reliable news but only 28% think it’s good at amusing or entertaining. Less than a quarter of Guardian readers (21%) think it is best for reliable news (because the BBC plays that role for many), but almost half (45%) value it for opinion and viewpoints.
Meanwhile BuzzFeed News, despite heavy investment in high-quality investigations this year, is still struggling to cast off its legacy as purveyor of listicles and quizzes and is instead valued most for entertaining and amusing content by its own user base.
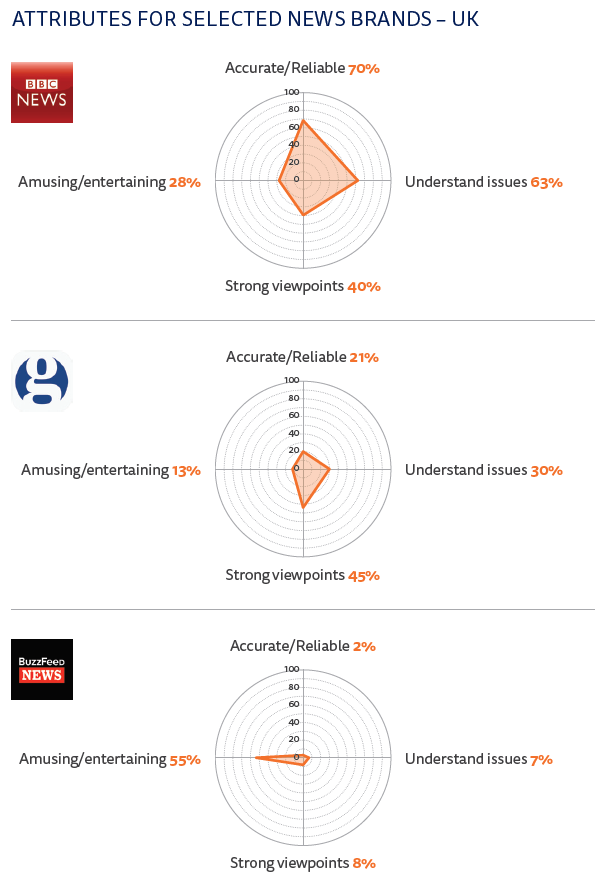
Base: All that used BBC News online/Guardian online/BuzzFeed News in the last week: UK = 1076/378/174.
In Italy, we find slightly different picture with no single brand considered best for accurate and reliable news. This function is more widely shared between the online edition of a number of major newspapers (La Repubblica, Corriere della Sera), TV channels online such as TG24com and the news agency ANSA, which has developed a consumer reputation for fast reliable news (46% of its users consider it is best for this). As in the UK, it tends to be organisations with a newspaper background like Il Fatto Quotidiano that score best for strong opinions (46% of its users rate it best here). Fanpage.it, which has focused distribution via social channels is considered best for amusing and entertaining content.
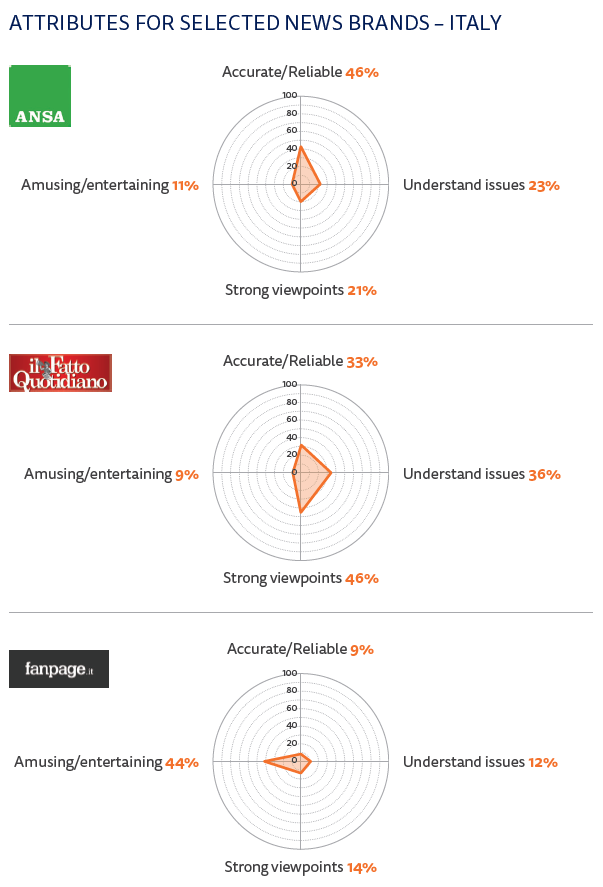
Base: All that used Ansa/Il Fatto Quotidiano/Fanpage in the last week: Italy = 422/308/163.
The dynamics of online news, where consumers can pick and mix between brands, means there is now less need for any one brand to deliver the entire package. In many countries, there are a small number of brands that people turn to for general news and this is requiring other organisations to be more distinctive and more specific in terms of their focus. In some cases this means carving a reputation for data journalism and investigations (BuzzFeed News), explanation (Vox), celebrity coverage (Mail Online), or intelligent writing (De Correspondent in the Netherlands) in order to attract a regular audience. Or it could mean focusing on a content niche like technology (Recode), an emerging format such video (NowThis), or a specific audience group (Mic, Vice).
These dynamics are still emerging but they mark a major change from the shape of the media landscape in the offline space.
The Business of Journalism
While audiences experience unprecedented choice and enjoy an ocean of free content, industry executives are increasingly worried about how to finance journalism.
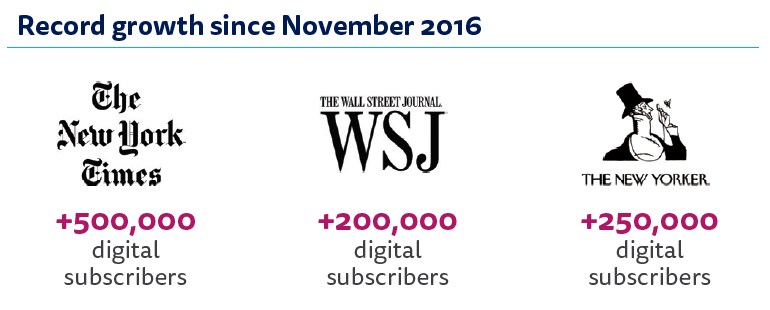
This year our survey included an extended set of questions about attitudes to paying for news. These data are supported by diaries and focus groups in four countries: the US, UK, Finland, and Spain. In general, we find a continued reluctance to pay for online news in any form – overall more than eight in ten (84%) have not paid in the last year. Having said that, we have seen a significant increase in the United States in the wake of the Trump victory where overall payment (including one-off payments and donations) has risen to 16%, with ongoing digital subscriptions running at half that (8%). These findings are consistent with figures released by news organisations, which show a significant Trump bump. The New York Times added around 500,000 digital subscribers in the six months since the election and the Wall Street Journal has added around 200,000 members. Our data show much of this growth has come from those on the left and the young – effectively showing support for the media’s efforts to hold the president and his policies to account.
Over a quarter of respondents in the United States (29%) said a key reason for paying was because they ‘want to help fund journalism’. That figure is twice as high as the all-country average (13%) and helps explain why we’ve seen such a change in the last year.
Base: Total 2014-2017 sample in each country.
Donations are up too – tripling in the United States and Australia in the last year, albeit from a very low base. The Guardian has reported selling 230,000 memberships at between £6 and £60 a month by March 2017, along with 160,000 one-off donations from around the world.8
In terms of the wider international picture, the biggest success story is in the Nordic region (see map), where rates of ongoing digital subscription are as high as 15% in Norway and 12% in Sweden, 10% in Denmark and 7% in Finland. Much of this relates to the strong reading tradition alongside a culture of print subscription, which has been transferred to digital through bundling and free trials. We’ve also seen a wide range of innovation in paywall techniques in this region including metered, freemium, and in some cases (e.g. Aftenposten) both at the same time. This region is also at the cutting edge of technology, using big data models to predict churn and experimenting with dynamic differential pricing for new customers. Attracting new customers using targeted Facebook advertising has been successful for many.
Despite this the main reasons cited for why non-payers remain reluctant to part with their cash are the widespread availability of free content (54%), and the fact that a ‘favourite brand’ doesn’t currently charge (29%). A much smaller proportion says news is not worth paying for. In focus groups too, we detected a sense that many more could be persuaded.
While it’s free, I’ll happily not pay for it. If there was a concerted effort, I think I’d pay – happily.
Male (40+), UK
On the other hand there was no consensus on the best way of charging.
Subscriptions worked for some, but not for all, particularly those who’d got used to moving freely from one site to another
I like to get news from all different sources, so if I’m going to pay for one, that’s frustrating to me.
Female (24–35), USA
While subscription is picking up in the US, in Southern and Central European countries like Greece, Italy, and Spain most online content remains free as there isn’t the subscription culture to build on. Significantly, there is also less disposable income and less willingness to pay for online media in general. Users in Greece are ten times less likely to pay for a music subscription like Spotify than those in Sweden (3% compared with 32%). Users in Hungary are seven times less likely to pay for an online TV subscription like Netflix or Amazon Prime than those in Norway (5% compared with 35%).
Meanwhile in many Asian countries there has been less of an immediate business incentive to pursue digital subscription aggressively. In Japan, print remains extraordinarily lucrative, while in South Korea newspaper groups depend heavily on government advertising as well as payment for content they supply to portals Naver and Daum. In markets like Hong Kong, banner advertising still commands comparatively high premiums and supports the employment of large numbers of journalists at publications like Apple Daily.
Simply put, there is no one size fits all model that is likely to work everywhere. It is much harder to make a news subscription work in some countries than others. Other business models, such as advertising, donations, and syndicated content, will remain a critical part of the mix for many years to come.
Ad-Blocking on Hold
One threat to the news industry seems a little less pressing. Our data show that there has been no significant increase in ad-blocking over the last year.
Around a quarter (24%) continue to use software that magically removes all advertisements. The figure is highest in Greece (36%) and Poland (32%) and lowest in Japan (13%) and South Korea (12%). Crucially, despite industry fears, it has not spread to the smartphone where only less than one in ten (7%) have worked out how to install blockers or browsers that block by default.
The threat has not gone away. In focus groups, those who were not aware of them expressed strong interest in using them, but for the moment usage is largely confined to the desktop. Younger groups are also almost twice as likely to use them.
Another hopeful sign has been the increasing proportion of respondents (43%) who have agreed to temporarily turn off their ad-blocker for particular news sites. Publishers have been experimenting with different approaches, ranging from messages that ‘ask nicely’, to offering ad-free subscription alternatives, and blocking content completely. The tough love approach seems to have worked best with over half of those who had whitelisted a site (58%) saying they did it because it was the only way they could see the content. A quarter (26%) responded to messages explaining that sites need advertising to survive.
It depends on the source I’m looking into. If it’s a reliable source I usually remove it and take the advertising, and then I put it back on, it’s like a wall that doesn’t let that mass advertising in.
Focus group (35–54), Spain
On some websites I don’t use it if I think the website deserves the ad income … I don’t use them on special interest pages where I know they need the money.
Focus group (35–54), Finland
Base: All who have ever disabled their ad-blocker for news: All markets = 11,513.
Conclusion
Journalism is being hit by forces that have been building for some time but the past year has seen this story break out from its media bubble to attract the attention of policy makers, politicians, and even the wider public. The news itself has become the news.
The abundance of content on the internet combined with new forms of distribution have contributed to a crisis of confidence in journalism where it is hard to distinguish verified facts from untruths, ‘alternative facts’, or information that is laced with extreme agendas. At the same time, the production of undifferentiated news, often with clickbait-y headlines, is now being exposed by social distribution where consumers are less aware of the original sources and don’t go out of their way to choose a specific news brand.
As a result we are reaching a crisis point where the pressure is building on both media companies and platforms to come up with solutions. That’s why we are seeing more news organisations refocusing on quality, unique journalism that people would be prepared to pay for,9 as well as ways to demonstrate the transparency, fairness, and accountability of their journalism (fact-checking, reader editors, etc.). And there is also a new focus on audience engagement, on driving ‘quality reach’ rather than just big numbers, and on building habit though email and mobile notifications. But these are not universal trends. In Asia, Latin America, and Southern Europe the focus on advertising income continues, while the willingness (or ability) of readers to pay directly is more limited.
From the platform perspective, there is an increased recognition that algorithms are rarely neutral, nor can they deal with the nuances and complexities of our modern world. As regulators and legislators circle in the wings, Google and Facebook are responding in various ways including – in the news area – through partnerships with independent fact-checkers and the testing of new algorithms that attempt to break people out of their bubbles.10 They know too that their long-term business depends on building far higher levels of trust than our survey demonstrates people currently have in social media in particular.
And then, even if those issues are resolved, the business questions remain. How can news organisations create enough value to persuade people to pay? Through cooperation and partnership can they create enough scale to compete with Google and Facebook in the advertising market, or at least within specific niches? What mix of models can bring in enough money to sustain quality journalism? Can the market provide all the solutions or might public subsidy be required, and if so with what implications for independence in an increasingly polarised political environment?
This year’s survey does at least include some more optimistic signs; the emergence of donations and other evidence of public support for journalism should encourage non-profits. The uptick in subscriptions in the United States is helpful, but is unlikely to be enough on its own. Ad-blockers may be in abeyance but the problem of getting display advertising to work on a mobile screen is yet to be solved. In parts of the world, membership models are emerging as just one of a number of potential new revenue sources while our country pages across 36 countries showcase more innovation around business models, distribution, and formats than we’ve seen for some time.
The crisis over fake news could be the best thing that has happened to journalism – or the worst. It is certainly focusing minds and wallets. Next year’s chapter in this on-going story will be fascinating to watch.
- We have six years’ data for the US, UK, France, Germany, and Denmark. In other cases we have been polling for a shorter period of time. ↩
- This equates to between 8 and 12% of smartphone users in those countries. ↩
- https://www.theguardian.com/media/2016/nov/17/barack-obama-fake-news-facebook-social-media ↩
- UK, US, Canada, Australia, France, Germany, Denmark, Greece, Spain, and Ireland. Focus groups held in UK, US, Finland, and Spain. ↩
- Polarisation score for each brand is the difference between the mean ideology (measured on a seven-point scale using Q1F) of the audience for each brand and the mean ideology of the population as a whole, divided by the standard deviation of the mean ideology of the population. ↩
- To make these charts comparable, the bubbles are positioned in terms of the level of dispersion we see in political leaning amongst the population as a whole. This means that in Germany news brands are not simply more centralised because the population happens to be centralised, and in the USA, news brands are not more polarised because the population is more polarised. A fuller description of how these charts were created is on our website. ↩
- https://newsroom.fb.com/news/2017/04/news-feed-fyi-new-test-with-related-articles ↩
- http://www.telegraph.co.uk/business/2017/04/27/guardian-claims-progress-heavy-losses-holds-talks-manchester ↩
- Mark Thompson, CEO, New York Times: ‘We want every story we report, every column of opinion we publish, to be worth paying for.’ https://www.theguardian.com/commentisfree/2016/dec/16/fake-news-journalism-digital ↩
- BuzzFeed, Facebook’s Charm Offensive: https://www.buzzfeed.com/craigsilverman/facebook-charm-offensive ↩