Methodology and Background
General Observations on Data
This study is based on analysis of data collected as part of the 2017 Reuters Institute Digital News Report. The original study was commissioned by the Reuters Institute for the Study of Journalism at the University of Oxford (RISJ) to understand how news is being consumed in a range of countries, including Turkey. Research was conducted by YouGov using an online questionnaire at the end of January/beginning of February 2017.
The data were weighted to targets based on census/industry accepted data, such as age, gender, region, newspaper readership, and social grade, to represent the total population of each country. The sample is reflective of the population that has access to the internet.
As this survey dealt with news consumption, any respondent who said that they had not consumed any news in the past month was filtered from the results to ensure that irrelevant responses did not impact data quality.
A comprehensive online questionnaire was designed to capture all aspects of news consumption. The questionnaire and the overall project methodology were consistent across all territories.
The survey was conducted using established online panels run by the polling company YouGov and their partners. Because this is an online survey the results will under-represent the consumption habits of people who are not online (typically older, less affluent, and with limited formal education). Where relevant, this has been made clear within the text. The main purpose is to track the activities and changes over time within the digital space, as well as gaining understanding about how offline media and online media are used together. A fuller description of the methodology and a discussion of non-probability sampling techniques can be found on the Digital News Report (DNR) website.4
Along with country-based figures, throughout the report aggregate figures are used based on responses from all respondents across all the countries covered. These figures are meant only to indicate overall tendencies and should be treated with caution.
Please note that in Turkey (as well as Brazil, Mexico, and other countries with relatively low internet penetration) the samples are more representative of urban rather than national populations, which must be taken into consideration when interpreting results.
The original survey included the following territories: Argentina, Australia, Austria, Belgium, Brazil, Canada, Chile, Croatia, Czech Republic, Denmark, Finland, France, Germany, Greece, Hong Kong, Hungary, Ireland, Italy, Japan, South Korea, Malaysia, Mexico, Netherlands, Norway, Poland, Portugal, Romania, Singapore, Slovakia, Spain, Sweden, Switzerland, Taiwan, Turkey, UK, USA.
The full questionnaire, as well as details of the samples used in each market, can be accessed on the DNR website.5
Specific Observations on Turkish Data
While the samples are over representative of the urban population in Turkey, the survey was carried out in all geographic regions of the country and not restricted just to a few major cities.
The survey base is composed of 2005 respondents. (1001 male, and 1004 female)
Figure 1: Age scale of respondents

Figure 2: Income level of respondents

Figure 3: Political leaning
 Q1F. Some people talk about ‘left’, ‘right’ and ‘centre’ to describe parties and politicians. (Generally socialist parties would be considered ‘left wing’ whilst conservative parties would be considered ‘right wing’.) With this in mind, where would you place yourself on the following scale?
Executive Summary
In Turkey, the most significant key findings from the survey relate to: the high level of distrust in news; the increase in the use of closed messaging services and the decrease of social media as a way of sharing news; the expansion of online media in being named as the main source of news; and the combination of a high level of interest in news with a high level of news avoidance.
Trust and Distrust
It is striking that the figures for overall trust (40%) and distrust (38%) in Turkish news media are remarkably similar. This is an indicator of a very polarised society and news media in the country.
- 40% of respondents trust news overall, and 46% of them trust the news they use, but distrust in news is also very high; 38% of respondents distrust news overall and 31% distrust the news that they use.
- While television (33%) has the lowest level of distrust in news overall, social media (50%) and printed newspapers (44%) have the highest level.
News Sharing and Social Media Messaging
It stands out that the use of Facebook for news fell by ten percentage points in the last year, with Twitter down by five points. The sharp downturn in the use of Facebook and Twitter for news may be related to fears of government surveillance. The rise of closed messaging services like WhatsApp (an increase of eight percentage points from 17% to 25%) as a way of sharing news may be linked to a climate where it is unsafe for public servants, in particular, to criticise the government on social media.
- 56% of respondents share news, and 40% of respondents comment on news in Turkey. Turkey is at the top for news sharing among European countries, and it is fifth across all markets, where Latin American countries (Brazil and Chile with 64%, and Argentina and Mexico with 63%) lead the way.
Sources of News
Online, including social media, is at the top of the list of sources of news used weekly, with a weekly reach of 89%, followed by TV (77%), printed media (47%), and radio (36%). However, judged by main news source, TV is first with 47%, and online, including social media, (39%) follows it. The shares of printed media (6%) and radio (6%) are quite low.
- • The percentage of respondents citing online media as the main source of news has remarkably increased from 32% to 39% in two years, with the gap between TV and online media consequently reducing from 19% to 8% in this period.
- • Younger groups are much more likely to use social and digital media as their main source of news, while older groups cling to the habits they grew up with (TV, radio, and print).
Top Media Brands
Television channels clearly dominate the traditional top brands.
- Fox TV is the most preferred source, both in weekly usage and as a main source, followed by CNN Türk, NTV and Kanal D.
- Hürriyet and Sözcü are the most popular printed newspapers, and CNNTürk, Mynet, Hürriyet and Sözcü are the most popular online news brands.
- Sözcü, critical of the ruling AK Party, clearly dominates three categories in best online media outlets, including providing ‘accurate and reliable news’, ‘strong viewpoints/opinions’, and ‘helping me understand complex issues’, with CNNTürk in second place.
News Devices
In terms of devices used to access news online, laptop/desktop computers and smartphones are the most important, both as main sources of news (43% versus 41%) and in terms of overall weekly reach (computers 54% and smartphones 63%).
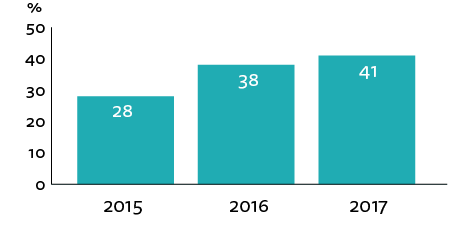
- The share of smartphones as the main device used to access news has risen very significantly from 28% to 41% in two years, due mainly to the decline in computers, which fell from 55% to 43% in the same period.
- Almost half of the online media as the main news source is composed of websites/apps of traditional media, namely TV and newspapers.
- 57% use their smartphones for news in bed, and 40% access news via smartphone in the bathroom/toilet.
News Interest and Avoidance
Interest in news is very strong in Turkey as 81% of respondents say they are ‘extremely’ or ‘very’ interested in news. However, news avoidance is also very high. Over half of the respondents in Turkey (57% ‘often’ or ‘sometimes’) avoid news.
- Turkey and Greece (57%) are at the top of the list for avoiding news across the 36 markets in the survey.
- Left-wing respondents (66%) are much more likely to say that they ‘often’ or ‘sometimes’ avoid the news than those on the right (48%).
- The 18–24 age group is clearly less interested than other groups.
Introduction
Turkey has been under a state of emergency since a failed coup in July 2016, in which 248 people were killed and hundreds injured, and the political turmoil has had a significant effect on the freedom and independence of the Turkish media. Turkish authorities have shut down over 160 media outlets, including 56 newspapers, 5 news agencies, 27 TV channels, 30 radio stations, 19 magazines, and 29 publishers, by using powers invested under the state of emergency.6
This figure does not include banned websites of online news media, which are estimated to be in the hundreds. One example shows the scale of the clampdown. Sendika.org, which shares news on labour force and union activities in Turkey, was blocked 61 times in the last two years, and the brand continues with www.sendika62.org.7 Removal of content from a news site or social media is an increasingly common tool used by the Turkish government.8
Figure 4: Circulation of printed media (newspapers and magazines)

Source: Turkish Statistical Institute
In Turkey, the circulation of printed media has been declining in recent years.9 2016 experienced a much more dramatic decrease mainly due to the closure of some newspapers after the coup attempt, with the number of printed newspapers and magazines declining by 7.9% and overall circulation falling by 20% in 2016 compared to 2015 (see Fig 4).10 These figures go far beyond the long-term rate of decline and are due to the extraordinary circumstances of 2016.
Apart from the closure of some titles, overall sales of other brands have not been much impacted at the news stand, but advertising revenues for newspapers have taken a hit. Printed media’s share of advertising revenues (14.8%) continued to decline in 2016, whereas digital advertising (24.2%) continues to grow and is now second only to television (51.2%).11
The pressure on opposition media outlets has led to the creation of a number of small-scale online journalism portals and platforms where free journalism is practised. Articles are shared via social media and increasingly via encrypted messaging apps. Indeed, mainstream media have been losing their monopoly over agenda-setting as digital-born news sites and social media are now often the first port of call for news.
The most used online news sites, however, continue to be those provided by traditional media brands using content repackaged from print (Hürriyet, down five percentage points, and Milliyet down eight percentage points), television (CNN Türk, down six percentage points, and NTV down nine percentage points), or from news agencies, but their percentage has declined remarkably in the past year. Despite the decline in their popularity (Mynet, down five percentage points, Haberler, down seven percentage points, and Ensonhaber, down four percentage points), digital-born web portals, which aggregate stories from newspapers and agencies, also play a major role in Turkey. The decline both in traditional media brands and digital-born web portals, as the figures show, indicates that other online brands have received a share from them.
While successful digital-born sites such as OdaTV (14%), OneDio (12%), T24 (8%), Diken (6%), and Bianet (2%) have retained their leading position in our survey compared to last year, the number of digital-born news brands has increased this year. These include Duvar, Karınca, Webiztv, Özgürüz, Artı Gerçek and 140journos, a prominent citizen journalism project that has gained attention for its pioneering use of social media to distribute content. Another approach comes from Journo, which provides a platform for freelance journalists and ensures they are paid via the MATRA human rights funds. Well-known reporters, many of whom have lost their jobs in recent closures, often contribute to this portal with exclusive stories. The Turkish sections of international brands such as BBC Turkish and DW also produce strong news stories about Turkey for use by people in-country or Turks abroad.
News Access, Interest and Avoidance
News Access
The survey shows that access to news in Turkey is slightly higher than average, as 91% of those surveyed report they access news once a day or more, compared to 89% across all markets (see Fig 5). However, the more revealing figure about the level of news use concerns those who access news more than five times a day, which is 37% in Turkey compared to 25% across all markets. A further 38 % of Turkish respondents access news between two and five times a day.
Figure 5: Access to news
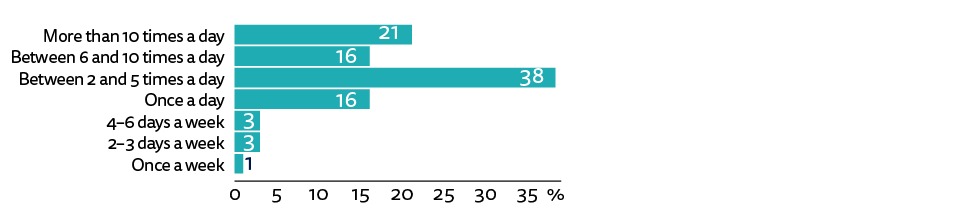
Q1b_NEW. Typically, how often do you access news? By news we mean national, international, regional/local news, and other topical events accessed via any platform (radio, TV, newspaper, or online).
Interest in News
When people are specifically asked how interested they are in news, the results also clearly indicate a strong level of interest in Turkey. Eighty-one per cent of respondents say they are ‘extremely’ or ‘very’ interested in news, whereas the total of those responding ‘not very’ or ‘not at all’ is only 3% (see Fig 6).
Figure 6: News interest

Q1c. How interested, if at all, would you say you are in news?
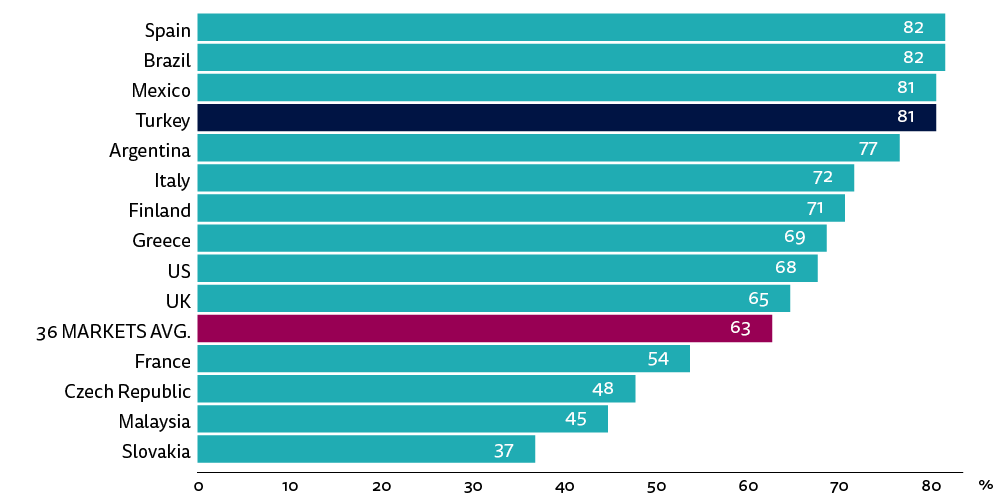
Across all 36 markets surveyed, the average figure for ‘extremely’ or ‘very’ interested in news is just 63%; Spain is top with 82% and Turkey close behind in fourth position with 81% (see Fig 7).
Figure 7: News interest (extremely or very) – selected markets
Any possible relation or correlation between levels of interest in news and main variables such as income level, political leaning, age, and education level merits close examination.
Figure 8: News interest and income level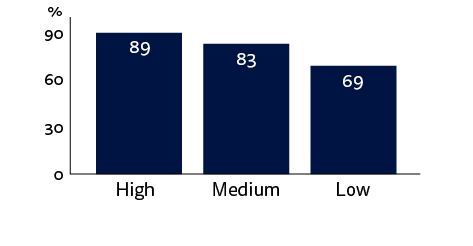
Figure 9: News interest and political leaning
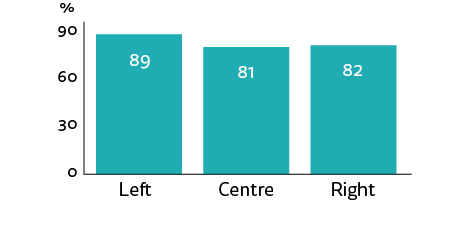
Q1c. How interested, if at all, would you say you are in news? (Showing ‘extremely’ and ‘very’ interested.)
The survey indicates that respondents with higher household incomes are more interested in news than those with low incomes (see Fig 8). The total of those with a high income level who are ‘extremely’ or ‘very’ interested in news is 89%, while those with a low income is 69%. The fact that the survey is conducted online in urban Turkey may have influenced these results.
As to the level of news interest and political leaning, the survey indicates slightly more interest on the left than the right (see Fig 9). The total of left-wing respondents who say they are ‘extremely’ or ‘very’ interested in news is 89%, as against 82% among people on the right.
Figure 10: News interest and age
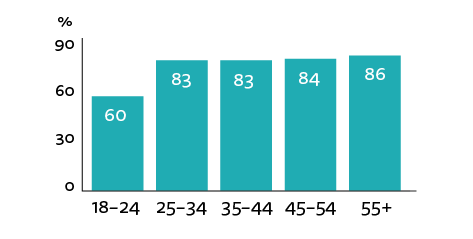 In terms of age, levels of news interest are fairly even for respondents over 25 years old. What stands out is that respondents in the 18–24 age group are clearly less interested than the other groups (see Fig 10). This is a common feature across the countries surveyed but much more marked in Turkey. There is a difference of 20 percentage points between the 18–24 age group who are ‘extremely’ or ‘very’ interested in news and the average for the whole population in Turkey (80%), as against 12 percentage points in all markets. Similarly, the total proportion of 18- to 24-year-old Turkish respondents who say they are ‘not very interested’ or ‘not interested’ in news is 9%, compared to only 1% in other age groups.
Figure 11: News interest and education level
 Interest in news clearly increases with the level of education (see Fig 11). Sixty-seven per cent of those who did not complete secondary/high school say they are ‘extremely’ or ‘very’ interested in news compared to 72% of those with secondary/high school or A-levels, and 86 % of those having a university education (BA, MA or doctoral).
News Avoidance
The idea of news avoidance aims to ‘explore the extent to which people find themselves actively avoiding the news’, and it is defined ‘not as total avoidance of news, since our base sample is made up of those who say they use news at least once a month, but rather as those who say they avoid news often or sometimes.’12
Figure 12: News avoidance
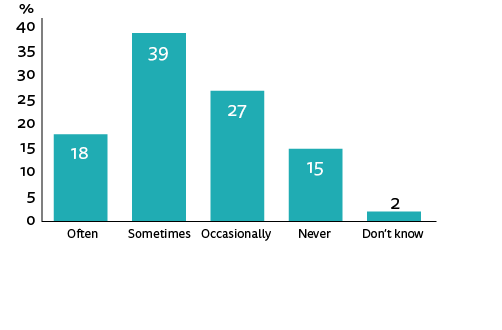 While Turks show a strong interest in news, news avoidance is also very high (see Fig 12). Over a half of the respondents in Turkey (57% ‘often’ or ‘sometimes’) avoid news. Only 15% of respondents never avoid news. Turkey and Greece (57%) are at the top of the list in avoiding news across the 36 markets in the survey. Since the average across all markets is 28.6%, this means that news avoidance in these two countries is twice the average (see Fig 13). Kalogeropoulos singles out Greece and Turkey when he suggests that ‘undergoing considerable economic and political turmoil, … may be a contributory factor to high levels of avoidance’ but suggests ‘it is not easy to identify a clear pattern’ across all 36 markets.
Figure 13: Proportion that sometimes or often avoid the news – all markets

Investigating the reasons why people actively try to avoid news can provide significant insights. More than half of the respondents (54%) said that the news ‘can have a negative effect on their mood’ (see Fig 14). Turkey, along with Ireland and Japan, is in fifth place behind Greece (62%), the UK (56%), the US (56%), and Canada (56%) for this reason. In Turkey’s case, this can be attributed to the country becoming very politicised and polarised in recent years. In addition, there has been a very negative news agenda with stories such as the failed coup attempt, terror attacks, human rights violations under the state of emergency, the problems of Syrian refugees, minority rights, and sexual abuse. People might be becoming tired of these issues.
Figure 14: Reasons behind news avoidance
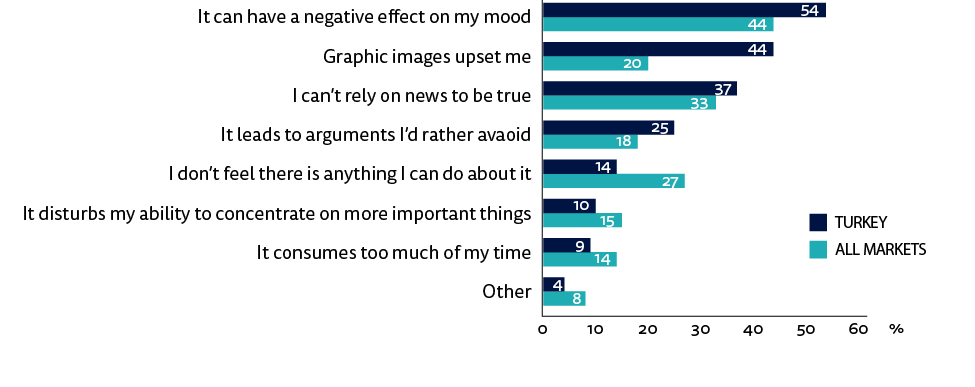
Q1dii_2017. You said that you find yourself trying to avoid news… Which, if any, of the following are reasons why you actively try to avoid news? Please select all that apply.
The second significant reason for avoiding news in Turkey is ‘graphic images upset me’. Forty-four per cent of respondents are negatively affected by graphic images, whereas the number is only 20% in all markets. Turkey is clearly at the top of the list in this area, and the reasons deserve close examination. It is very common for media outlets in Turkey to publish and broadcast sensational photos and videos to increase their circulation and ratings. They include terror attacks, explosions, traffic accidents, violence against women, fighting, social protests, and human rights violations. At the request of the government, the prosecutors have largely banned the use of such images, but these bans are slow to take effect in online media. It should also be underlined that the implementation of codes of media ethics is very poor, and studies confirm that ‘ethical codes and standards are not being followed in the Turkish media because of commercial constraints underlined by increasing concentration in the sector’.13 Therefore, media outlets mostly use such graphic images to compete, and there seem to be strong grounds to hold them responsible for this extraordinarily high figure.
‘I can’t rely on news to be true’ (37%) and ‘It leads to arguments I’d rather avoid’ (25%) are the two other main reasons cited for avoiding news in Turkey. While levels of distrust in Turkey and all markets are close, avoiding any possible arguments is higher in Turkey than the international average. Turkey is in fifth place across all markets in this category after South Korea (56%), Taiwan (44%), Croatia (34%), and Hong Kong (32%), with very low figures in most European countries. Strong polarisation in society might be the reason behind this high score in Turkey.
Figure 15: News avoidance and political leaning
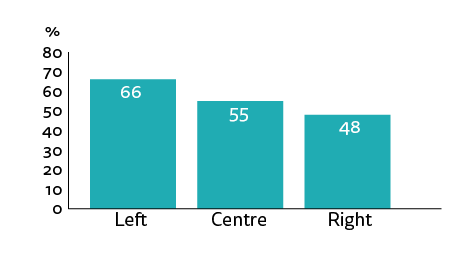
The relation between news avoidance and political leaning is remarkable (see Fig 15). Left-wing respondents (66%) who say that they ‘often’ or ‘sometimes’ avoid news are clearly higher in number than those on the right (48%). This ratio is 55% in the centre. The percentage of people that never avoid news is also 23% on the right, whereas it is 12% on the left.
The results are not surprising, given that the ruling AK Party, which is a conservative party, has been in power for the last 15 years. The country is divided into two almost equal camps between the supporters of the AK Party and its opponents.14 The political discourse and practices of ruling party is divisive and exclusionary.15 ‘Us versus them’16 is the main rhetoric in their statements and policies, and those in the ‘no’ camp during the historic constitutional referendum in April 2017 giving the president new crucial powers were even accused of being terrorists or coup supporters.17
Furthermore, the government largely controls the coverage of TV stations and printed media, and some of them operate as the mouthpiece of the ruling party.18 Several analysts have pointed to the one-sided nature of the coverage of Turkish media in favour of the ruling party in the recent referendum.19 For example, one study for Al Jazeera found what they described as ‘a staggeringly unequal amount of live TV coverage for the opposing campaigns’ in the referendum, with 458 hours for the ‘Yes’ campaign compared to 45 hours in total for the ‘No’ campaign.20 The news bulletins and debates had been largely dominated by the deputies, along with scholars and journalists who are supporters of the ruling party.21 This means that news consumers were exposed to the speeches of the ruling party leaders and its supporters all day.
Females are more inclined to avoid news (62% responded ‘extremely’ or ‘very’) than males (52%), although the variation is not as strong. The percentage citing ‘having a negative effect on their mood’ and ‘graphic images’ is higher for females than males, while ‘leading to arguments I’d rather avoid’ and ‘not relying on news to be true’ are the reverse.
Sources of News
Distribution of News Sources
Several questions were asked in the survey to understand where the people of Turkey get news from. The results vary according to whether people are asked to name what sources they use each week or to choose a ‘main’ source. The consistent pattern in most countries is that television and online news are the most frequently accessed, while readership of printed newspapers has declined significantly.22 This is also the case in Turkey, as TV and online media dominate the main sources.
When social media is included in the online news category it is clear that, overall, it is much more widely used than TV; however, it remains behind TV as the ‘main source’. Online has, though, remarkably increased its position from 32% to 39% in two years, and TV’s lead as the ‘main source’ has reduced from 19% to 8%. While social media is cited frequently as a source of news, less than one-fifth of respondents see it as their ‘main source’. Newspapers and radio are used by very few people as the main source, but they are still widely used – by between one-third and a half of respondents – as one weekly source among many.
Online news including social media is at the top of the list of sources of news used in the last week with 89% (see Fig 16). It is followed by TV (77%), printed media (47%), and radio (36%). However, the ranking and popularity of sources change when respondents are asked about their ‘main source’ of news in the last week (see Fig 17). TV comes first with 47%, and online including social media (39%) follows. The shares of printed media (6%) and radio (6%) are very low as main sources. The fact that printed news media is equal to radio shows the decreasing role of newspapers.
Figure 16: A source of news in the last week
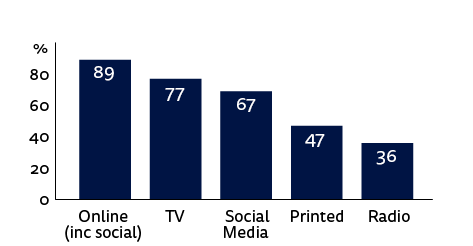
Q3. Which, if any, of the following have you used in the last week as a source of news? Please select all that apply.
Figure 17: Main news source
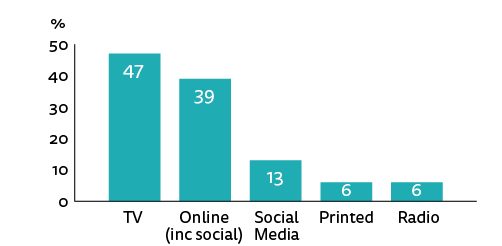
Q4. You say you’ve used these sources of news in the last week, which would you say is your MAIN source of news?
Figure 18: A source of news in the last week over time
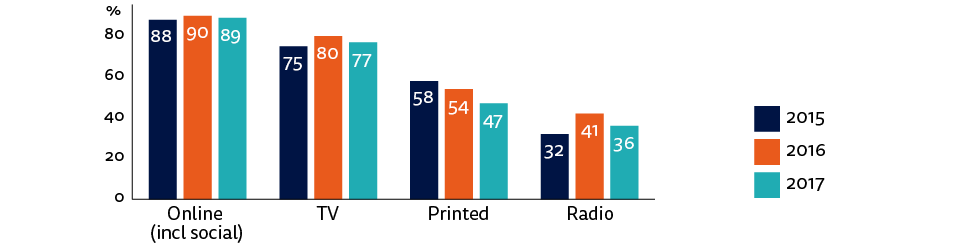
When we look at the change in recent years, we see that online news remains stable as a source of news each week, and it is always the most cited source (see Fig 18). The popularity of TV has not changed a lot, and it maintained its position between 75% and 80%. The printed media is in decline and fell 11 percentage points in two years, but it is still a weekly source for almost half of respondents.
Figure 19: Main news source over time
Changes are greater for the main source of news, where the share of online media has gradually increased in two years. Figure 19 shows that this increase mainly stemmed from the decline in TV (by four percentage points) and printed media (by three percentage points) in this period.
A detailed examination of the sources of news provide more comprehensive insights. The popularity of 24-hour news television channels and television news bulletins/programmes are very close to each other, both as the main and weekly source of news, as shown in Figure 20.
The distribution of online including social media (39%) as the main news source is significant. Thirteen per cent of respondents cite social media as their main source of news, and 7% of respondents cite websites/apps of other news outlets, that mainly refer to the digital-born news media. The websites/apps of traditional sources, namely TV, newspapers, and magazines occupy an important place in this category. The percentage of websites/apps of newspapers is nine points, TV/radio is seven points, and news magazines is two points. In short, the websites/apps of traditional media constitute almost half of the online media.
Regarding newspapers, the remarkable point is that their largest audience as the main source of news is online: the popularity of websites/apps of newspapers is 9%, whereas it is only 5% in print.
Figure 20: Source of news
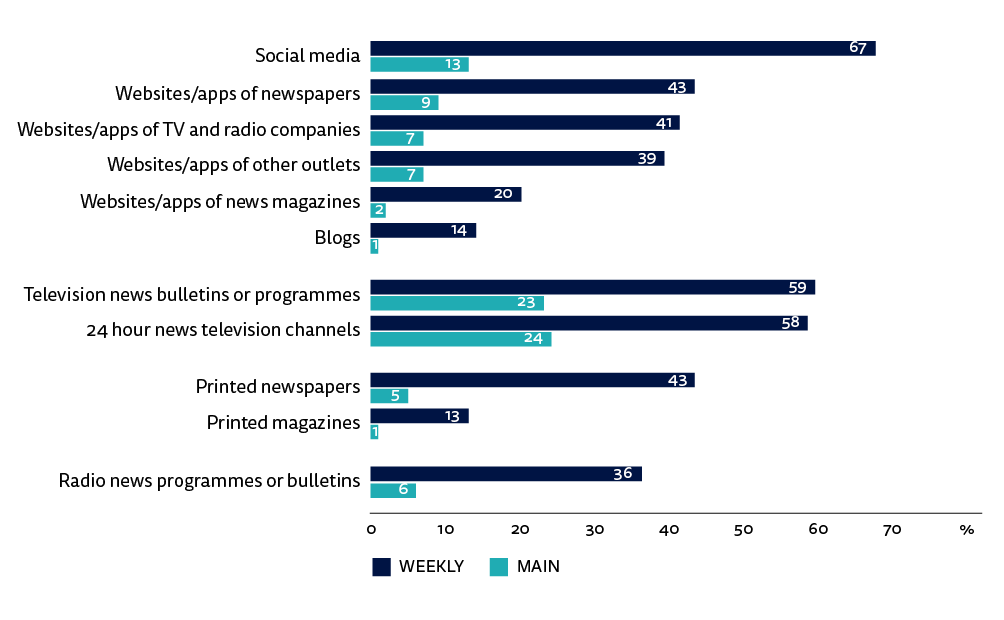
Q3. Which, if any, of the following have you used in the last week as a source of news? Please select all that apply. Q4. You say you’ve used these sources of news in the last week, which would you say is your MAIN source of news?
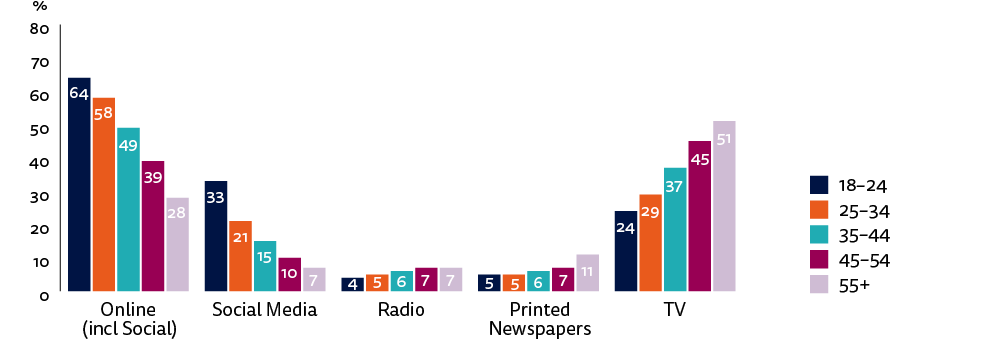
Figure 21: Main news source by age – Turkey

As to the relation between sources of news and age, Figure 22 illustrates that across all countries younger groups are much more likely to use social and digital media as their main source of news, while older groups cling to the habits they grew up with (TV, radio, and print).23 Figure 21 shows that this pattern also holds in Turkey, as younger people prefer social and online media as their main news source compared to older audiences who preferred TV news. However, the variation is not as strong as in the average across all markets in the survey. Looking across all markets there is a difference of 27 percentage points between 18- to 24-year-olds and those age 55+ citing TV as their main source of news, and the difference is 36 percentage points for ‘online including social media’ as their main source. However, in Turkey the difference between the two age groups is just 9% for TV as a main source and 11% for ‘online including social media’.
In Turkey, we also see that online news is the primary source only for the 18–24 age group (see Fig 21). Online and TV are equal for the 25–34 age group with 42%. For respondents over 35 years old, TV is the primary source of news followed by online media.
Figure 22: Main news source by age – all markets
One of the remarkable points shown by Figure 23 is that the main source of news varies with political leaning. Online media (42%) is the primary source for left-wing respondents, whereas TV (58%) is for those on the right. Social media is also used more by left-leaning respondents (18%) than those on the right (8%). High usage of online news and social media on the left might be because these respondents are seeking out more alternative viewpoints online. The converse applies too, since there is a great difference (29%) between those respondents on the right who cite TV as their main source as opposed to online media.
Another notable point is that printed newspapers have a 9% share as a main source for the left while it is zero for respondents on the right. Radio’s share as a main source also varies by political leaning, with just 5% as a main source on the left and twice that on the right. The total of TV or radio is 68% on the right, whereas it is 47% on the left. Not surprisingly for Turkey, this suggests that respondents with a right-wing orientation prefer broadcast and audio media, and they do not like reading a lot, whereas reading in accessing news is more popular for the left-wing.
Figure 23: Main source of news by political leaning and income level
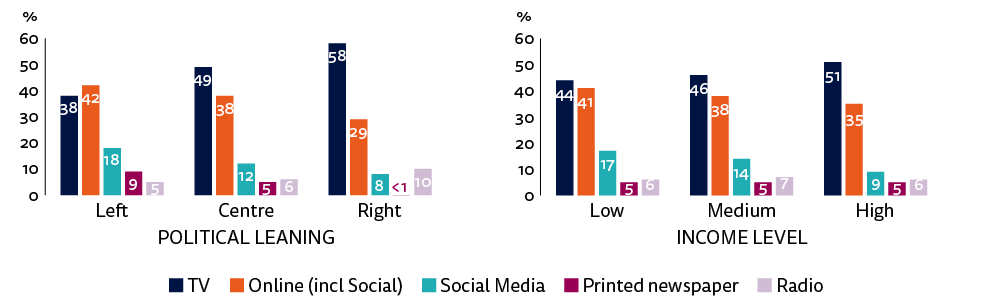
Surprisingly, the share of TV as the main source of news increases as the income level rises, although the difference is not strong. Online media is also more popular in the low-income level than the high.
Top Brands
Figure 24: TV and print top 20 brands
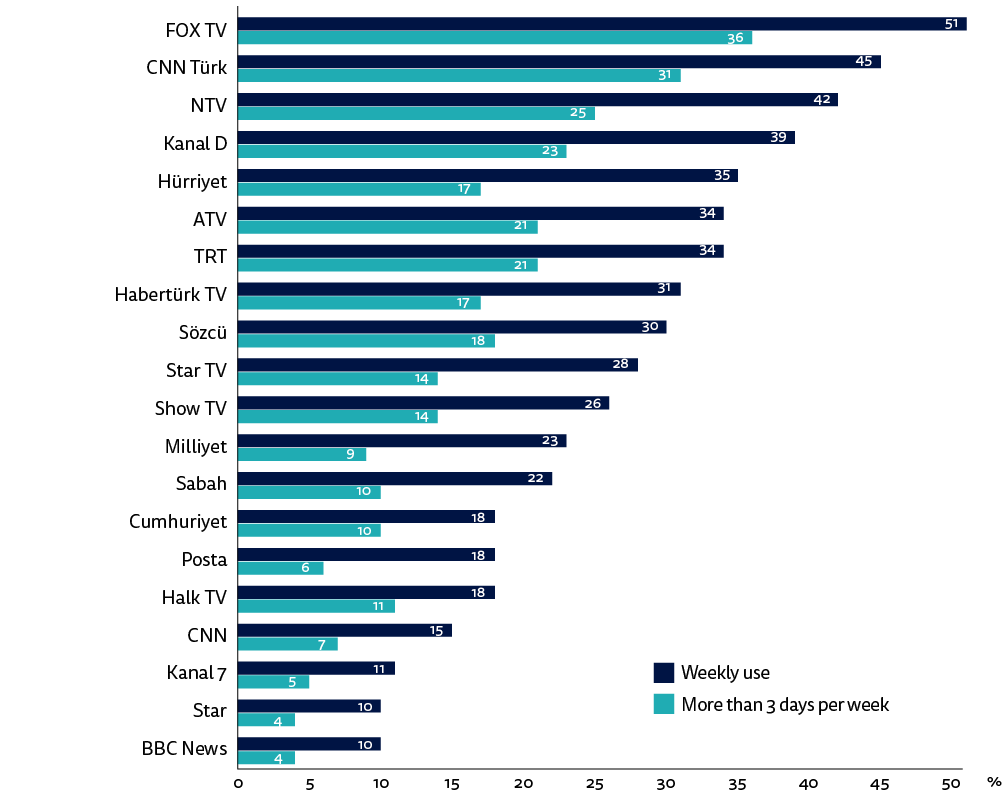
Q5a. Which of the following brands have you used to access news **offline** in the last week (via **TV, radio, print, and other traditional media)?** Please select all that apply. Q5ai. You said you have used the following brands to access news offline in the last week…Which of these, if any, did you use on 3 days or more? Please select all that apply.
Television channels clearly dominate the traditional top brands, as shown in Figure 24. There are only two newspapers (Hürriyet and Sözcü) in the top ten. FOX TV, which is a Turkish prime-time channel, may owe its top position to its perceived impartiality and ability to criticise the ruling party. Twenty-four-hour news channels, namely CNNTürk, NTV, and Habertürk TV, also have a strong position in the list.
ATV, which is widely described as the mouthpiece of the ruling party, and the national broadcaster, TRT, which is a clear propaganda instrument of the government, have a strong audience, too.24
The ranking also shows that well-known newspapers such as Habertürk, Akşam, Vatan, Yeni Şafak and Türkiye, which were seen as the mainstream media until recent years, are not included in the top twenty brands because of their relatively limited audience.
Halk TV, which is depicted as a mouthpiece of the opposition People’s Republican Party (CHP), has an improved position, particularly after the Gezi protests.25 In terms of sources used more than three days per week, its popularity (11%) is close to that of mainstream TV channels such as Star TV and Show TV (both 14%).
Figure 25: Online top 20 brands
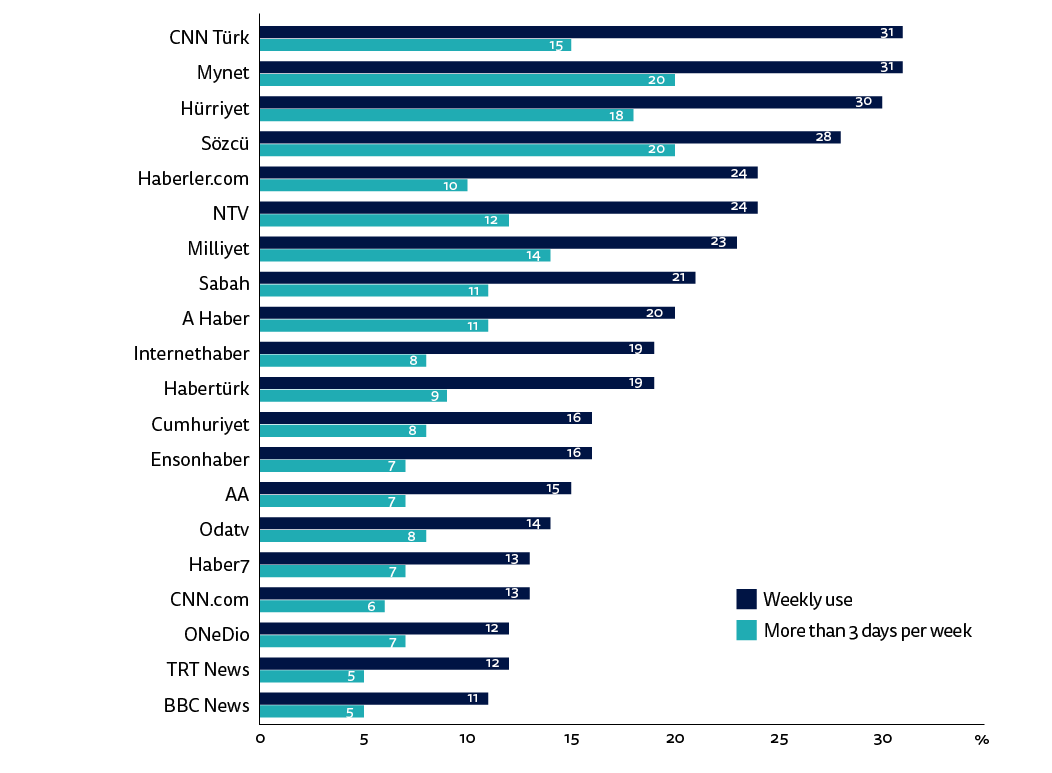
Q5bi. You said you have used the following brands to access news online in the last week… Which of these, if any, did you use on 3 days or more? Please select all that apply. Q5b. Which of the following brands have you used to access news **online** in the last week (via **websites, apps, social media, and other forms of Internet access**)? Please select all that apply.
We saw earlier that websites/apps of traditional media, namely TV, newspapers, and magazines, constituted 46% of ‘online including social media’ as the main source of news, whereas the share of digital-born news media is only 18%. This pattern is evident in the list of top online brands (see Fig 25). A 24-hour news channel, CNNTürk, and dailies Hürriyet and Sözcü perform very strongly online. News aggregators, namely Mynet, Haberler and İnternethaber, have three brands in the top ten. They do not generate their own news stories but re-publish the stories of news agencies, newspapers, or TV. Sabah and A Haber, widely described as mouthpieces of the ruling party, rank at eighth and ninth place.
As a digital-born news media that generates exclusive stories and hires its own columnists, OdaTV has the highest rank on the list in fifteenth place, followed by Haber7.
The case of the official Anatolian News Agency (AA) is remarkable, as it is in fourteenth position on the list. It is not a digital-born news media, and it distributes its services, including video and photos, to its paying subscribers. The agency also shares some of its news stories through its website and social media accounts. The reason why the agency has gained a significant place is that most of the media outlets depend on its news stories under the state of emergency. It benefits from being a state-run agency, in particular, in news on investigations into the failed coup attempt. Its stories have been widely re-shared on social media.
Which Online Sources are the Best for…?
The survey also asks respondents to name the best media outlets in the following four categories: ‘accurate and reliable news’, ‘strong viewpoints/opinions,’ ‘helping me understand complex issues’, and ‘amusing or entertaining me’. It is useful to see the top list for each category.
Sözcü daily, critical of the ruling AK Party, and one of Turkey’s last remaining independent media, clearly dominates three categories, with the exception of amusement/entertainment, and it is followed by CNNTürk (see Figs 26–29). The most remarkable media outlet in this question is A Haber, which one recent study describes as operating ‘as the government mouthpiece’.26 It is in third place in providing accurate and reliable news. A Haber is also in the top five, for both ‘providing strong opinions’ and ‘helping in complex issues’. Other than for the criteria of ‘amusing or entertaining me’, the list and rankings are very similar. Mynet is the preferred outlet in this category. OneDio, which is not on the top ten list of other three categories, is fifth here.
Figure 26: Top 10 for ‘providing accurate and reliable news’
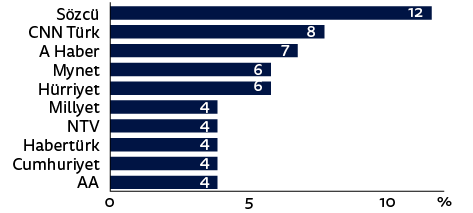
Figure 27: Top 10 for ‘providing strong viewpoints and opinions’
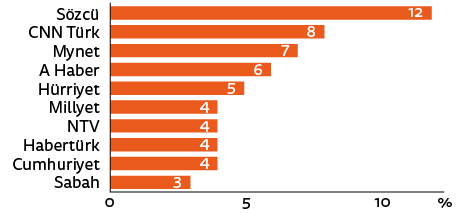
Q5c_2017_rc_3. 3. You say you use the following brands for **online** news. In your experience, which of these is best for providing ‘accurate and reliable news’/ ‘strong viewpoints/opinions’? Base: All those who have used online brands last week.
Figure 28: Top 10 for ‘helping me in understanding complex issues’
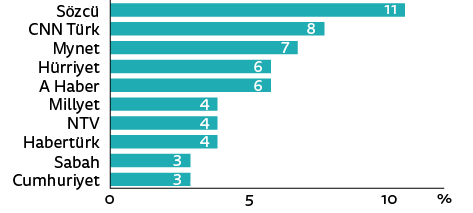
Figure 29: Top 10 for ‘amusing me or entertaining me’
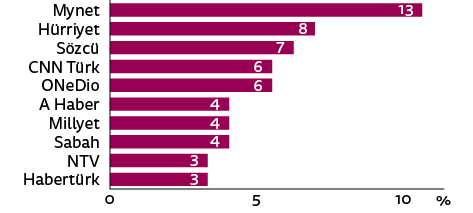
Q5c_2017_rc_3. 3. You say you use the following brands for **online** news. In your experience, which of these is best for ‘helping me understand complex issues’/’amusing or entertaining me’? Base: All those who have used online brands last week.
News Consumption: Devices and Gateways
Devices Used
Laptop/desktop computers and smartphones are the most commonly used devices to access news, both as the main device and in terms of weekly reach (see Fig 30). However, the smartphone’s share as the main device has risen significantly, from 28% to 41% in two years, due mainly to the decline in computers, which fell from 55% to 43% in the same period.
While smartphones (63%) are preferred to the computer (54%), in terms of weekly use their share is very close as the main device for news. (computers 43% and smartphones 41%). Tablets remained a distant third.
Figure 30: Devices used
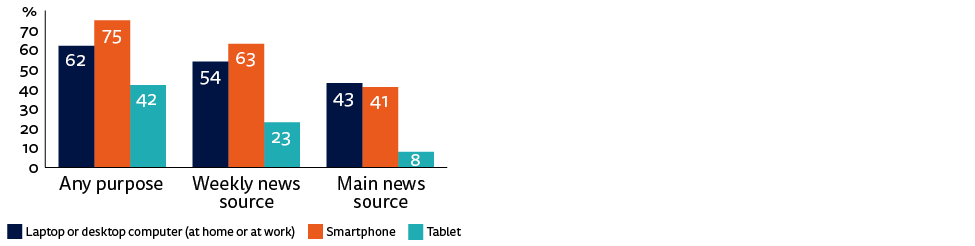
Figure 31: Weekly news reach per device
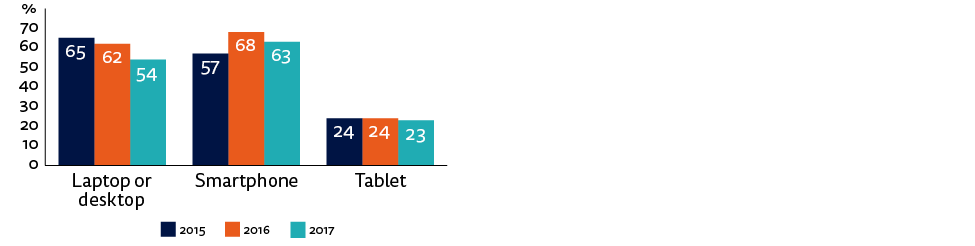
Figure 32: Smartphone as the main device
Q8A. Which, if any, of the following devices do you ever use (for any purpose)? Please select all that apply. Q8B. Which, if any, of the following devices have you used to access news in the last week? Please select all that apply. 8b6_5. You’ve said you use the following devices to access news in the last week, which is your MAIN way of accessing online news?
Age is an important factor when looking at the devices that people use to access news. The global pattern is that computers are used more commonly among older people while younger generations predominantly use smartphones for accessing news.
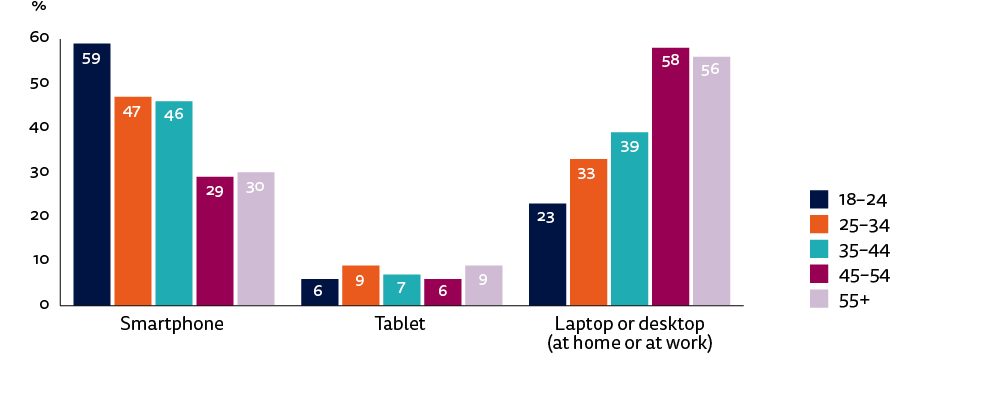
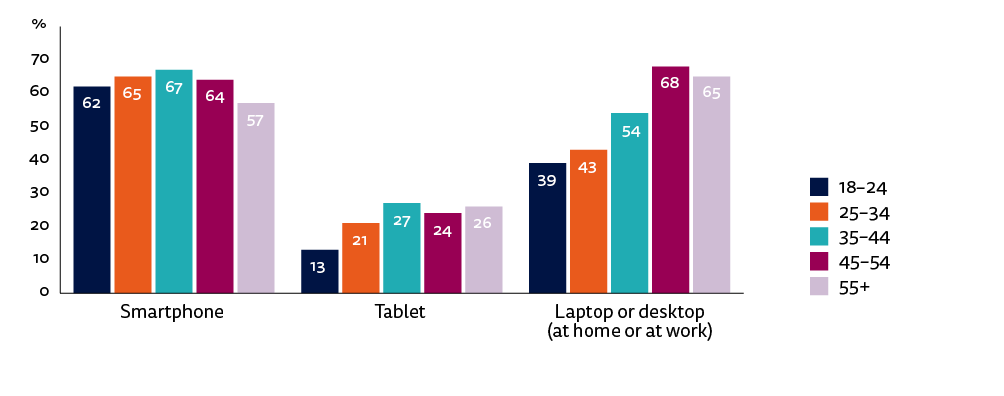
We see the same pattern in Turkey in the main devices for accessing news. The younger the respondents the more likely they are to use smartphones to access news (see Fig 33). In terms of weekly use, (see Fig 34) this ranges from 59% to 29% across the five age groups. In the 18–24 age group, 59% use the smartphone weekly, whereas in the 45–54 age group the figure is 29%. Computer usage (laptop or desktop) ranges from 23% to 58%, with older respondents making more use of them than younger.
Figure 33: Main news devices by age
8b6_5. You’ve said you used the following devices to access news in the last week, which is your MAIN way of accessing online news?
Figure 34: Weekly news devices by age
Q8B. Which, if any, of the following devices have you used to access news in the last week? Please select all that apply.
When looking at weekly reach, the trend of computers being used more by older people holds (see Fig 34), whereas smartphone weekly use is very similar across all age groups.
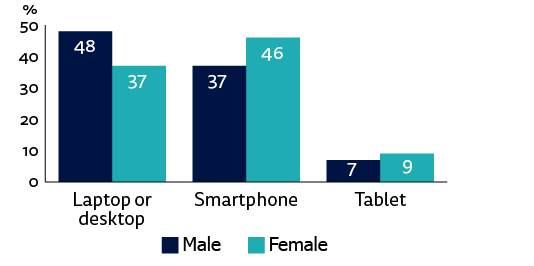
Figure 35: Main news device by gender
8b6_5. You’ve said you used the following devices to access news in the last week, which is your MAIN way of accessing online news?
Furthermore, as Figure 35 shows, there is a small but interesting difference between men and women in the main devices they use for news. The computer is the main device for men (48%) while it is the smartphone for women (46%).
Gateways
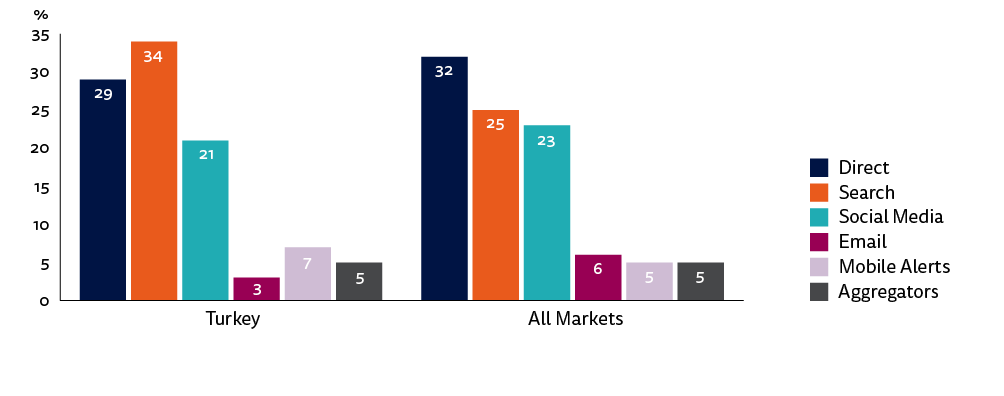
Figure 36: Main gateways to online news
Q10a_new2017_rc. Which of these was the **MAIN** way in which you came across news in the last week?
The significant difference between Turkey and the average of all markets in the preferred main gateway is about direct access and search, as shown in Figure 36.27
In Turkey, the primary route is search (34%), whereas it is direct access (32%) across all markets.
One might expect a striking difference between the younger respondents and the older ones, with younger groups preferring social media as the main route. However, that is not the case in Turkey. Where we see the greatest difference is in the use of direct access to a particular media outlet among different age groups (see Fig 37). The youngest cohort (18–24) makes the least use (17%), whereas it is around twice that level for over-35s. The older respondents have stronger brand loyalties. This might be because the political stances of older people are more established, hence they are more attached to particular news media.
Figure 37: Direct access by age

Q10a_new2017_rc. Which of these was the **MAIN** way in which you came across news in the last week?
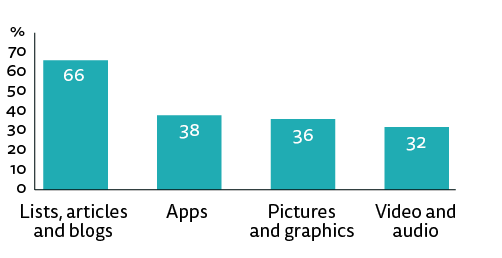
Figure 38: Ways of looking at the news online
Q11. Thinking of the way you looked at news online (via any device) in the last week, which of the following ways of consuming news did you use? Please select ALL that apply.
The most commonly used route to news is ‘looking at the list of news headlines’ (41%), followed by ‘read news stories or articles’ (36%). Using an application on the smartphone is also high (31%).
When we look at the net figures, as Figure 38 shows, lists, articles and blogs are the most preferred route (66%). The total for applications on smartphones and tablets is 38%. Turkey ranks third in looking at online news with apps, behind Hong Kong (42%) and Switzerland (41%), while the average of all markets is 27%. For Turkey, this probably stems from the dominant role of online news and high usage of smartphones.
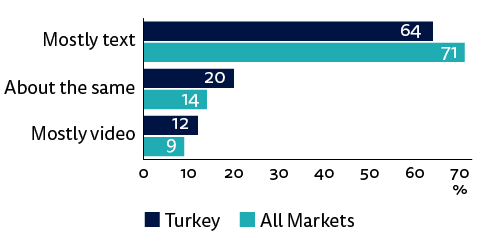
Turkey is also at the top of list in looking at ‘pictures and graphics’ (36%), whereas the international average is 22%. It is not a surprising result for Turkey, as most online news media use pictures to attract an audience. What is more, they tend to publish a news story with a photo gallery instead of a text and a photo. Each picture includes one or two sentences and a news piece, particularly on sports and in magazines, is composed of a dozen photos in this way. The figure concerning preferences for text or video for news also shows that text scores less well in Turkey than the average of all markets, even if it remains in the lead in 36 markets (see Fig 39).
Figure 39: Preference for text or video for news
OPTQ11D. In thinking about your online news habits, which of the following statements applies best to you? Please select one.
Despite greater exposure to online video news, Newman finds that ‘overall preferences have changed very little’ in the four years.28 We see that video consumption is more popular in Turkey. Across all markets, over two-thirds of respondents (71%) say they mostly consume news in text, with 14% ‘using text and video equally’29 whereas the figures are 64% and 20%, respectively, in Turkey. The poor reading habits in Turkey are likely to play a part in explaining these differences, given that a smaller number of Turks read books regularly than people in European countries.30
The reason why text is so popular is that it ‘provides control and speed when in information seeking mode’, while video ‘comes into its own by adding drama, context or reality to events, and also adding credibility to text’.31
Trust, Distrust and Polarisation
Trust and Distrust in News
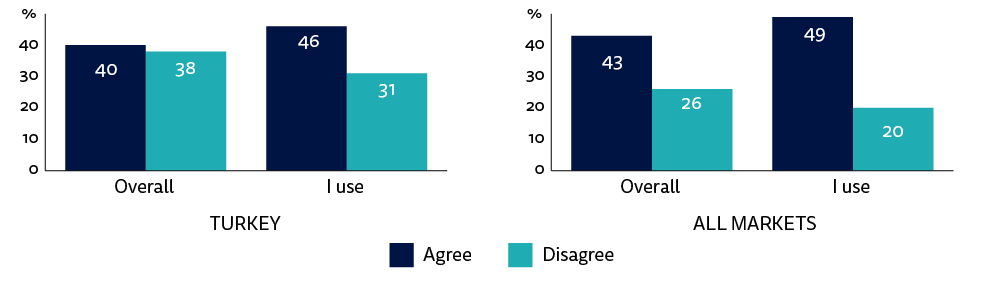
The most remarkable and significant point regarding the figures for overall trust and distrust in Turkish news media is that they are remarkably similar (see Fig 40). Forty per cent of people said that they trust most news most of the time, and 38% of people said they do not trust most news most of the time. The proportion who ‘neither agree nor disagree’ is 22%. This phenomenon can be attributed to the very polarised society and news media in the country, as we discuss in more depth later in this chapter by examining the media brands and political leaning.
One might expect lower trust levels in a country where the media is largely controlled by the government. However, this may be misleading because it ignores the fact that trust may be high among those who agree with the government, which seems to be the case in Turkey.
Although there is a high level of polarisation in the Turkish news media, there is also a sense that people nonetheless recognise some of the problems associated with high levels of government influence. Forty per cent of Turkish respondents trust news overall, while this figure increases slightly to 46% when they are asked specifically about trust in the news they use, indicating that these people perceive problems with the news as a whole.
Figure 40: Trust and distrust in news
Q6_2016_1. I think you can trust most news most of the time. Q6_2016_6. I think I can trust most of the news I consume most of the time.
On the other hand, when we look at the share of those who ‘disagree’ with the propositions on trust, thereby reflecting distrust, it is striking that the level of distrust in Turkey is very high, at 38%. The proportion who ‘disagree’ with ‘trust in news I use’ is 31%, and the figure for those who ‘neither agree nor disagree’ is 24% in this category.
All these figures are an indication of not only distrust in media coverage and content but also high polarisation. The respondents seem to be divided into two camps, either trusting or distrusting news media. People in either camp prefer to trust what they want to believe without questioning the reliability and accuracy of the news.
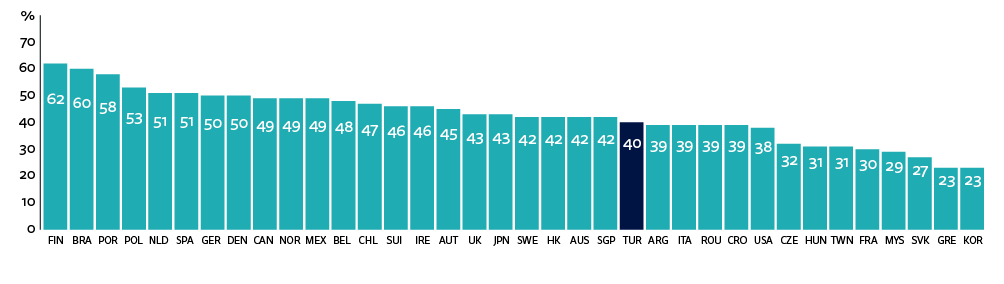
Meanwhile, we avoid international comparison in terms of ranking among all markets, given that the countries in five continents in the survey have different media systems and political understanding. There is a great variation in trust across the 36 countries, as Figures 41 and 42 illustrate; it is highest in Finland (62%), but lowest in Greece and South Korea (23%).
Figure 41: Overall trust in news media – all markets
Q6_2016_1. I think you can trust most news most of the time.
Figure 42: Overall distrust in news media – all markets
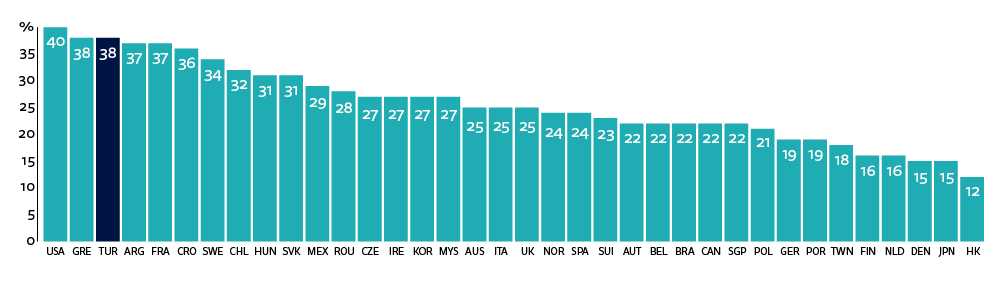
Q6_2016_1. I think you can trust most news most of the time.
The high level of distrust in Turkey requires us to look at how this breaks down by the main news sources that are used (see Fig 43). Social media is the most distrusted main news source, both in terms of overall trust and for the ‘news I use’. It is very significant that 45% of respondents distrust the news that they use on social media. Printed media follows social media, but there is a difference of ten percentage points between overall trust and trust in ‘news I use’ and the level of distrust is lower in online media than for print. We should also underline that there is a difference between social media and online news including social media: seven percentage points overall and eight percentage points in ‘news I use’.
Figure 43: Distrust in news and main news source
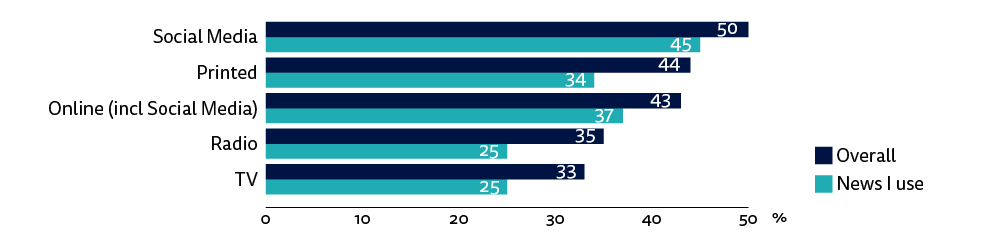
Q6_2016_1. I think you can trust most news most of the time. Base: Disagree Q6_2016_6. I think I can trust most of the news I consume most of the time. Base: Disagree. Q4. You say you’ve used these sources of news in the last week, which would you say is your MAIN source of news?
Television clearly has the lowest level of distrust in Turkey. As Newman points outs, one reason might be that video adds reality to events and credibility to the text.32 In Turkey, people are more inclined to believe what they watch rather than what they read, but this phenomenon is not enough to explain the results when we look at the average of 36 countries in the survey. Printed media and TV have very similar levels of distrust in all markets. In Turkey, distrust in printed media is more than twice the international average, and a third of respondents distrust the printed media that they use. The ruling party has largely contributed to such a high level of distrust in printed newspapers as President Recep Tayyip Erdoğan, who was prime minister for 11 years, has repeatedly targeted certain newspapers by criticising their headlines and columnists.33
Figure 44: News media independence
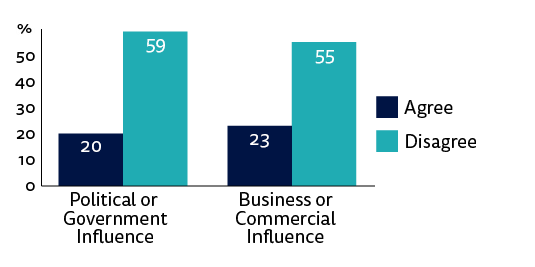
Q6_2016_4. The news media in my country is independent from undue political or government influence most of the time Q6_2016_5. The news media in my country is independent from undue business or commercial influence most of the time
As distrust in news in Turkey is very high, few respondents think that the news media is independent of undue political/government and business/commercial influence (see Fig 44). Only 20% of respondents think that the news media is independent of undue political or government influence most of the time, whereas 59% disagree with this. Furthermore, 23% of respondents agree that the news media is independent of undue business or commercial influence, while 55% disagree with this statement.
While only 20% of respondents think that news media is independent of undue political or government influence, trust in news overall is twice as high (40%). When we look at the political leaning of people who agree that news media is independent of undue political or government influence, there is a merked difference between those on the right (37%) and those on the left (17%).
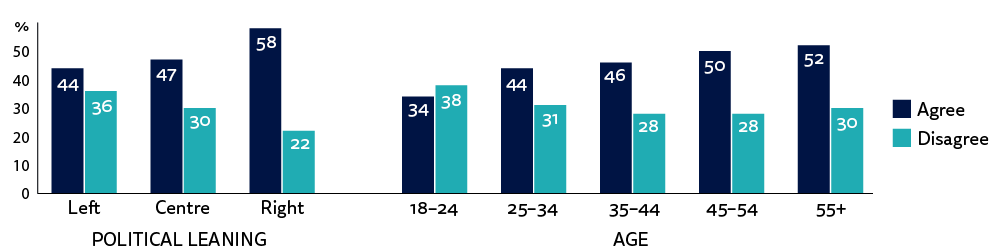
The survey also shows that overall trust in news is higher on the right (48%) than the left (37%), as shown in Fig 45. It increases in all political orientations when the respondents are asked about the ‘news they use’, as it is 58% on the right and 44% on the left (see Fig 46). In trust in news overall, the reason why the distrust (45%) is higher on the left than the right (34%) is likely to be due to a sense that the ruling party largely controls the media, and the number of critical or impartial news media is very limited. Remarkably, the level of distrust in ‘news I use’ is also higher on the left (36%) than the right (22%). This indicates that left-oriented respondents have a more critical approach towards the media than those on the right. It appears that the overall conclusion from the Digital News Report, suggesting that ‘in many countries the underlying drivers of mistrust are as much to do with deep-rooted political polarisation and perceived mainstream media bias’, holds true in Turkey. 34
In addition, we see that age is a significant driver of trust. The youngest respondents have the lowest level of trust in news overall, with just 27% in the 18–24 age group, whereas the figure is 45% for over 45s (see Fig 45). The same applies to trust in the ‘news I use’, where the older the respondents the higher the trust, with a variation of 18 percentage points between the youngest and oldest age group (see Fig 46). We have seen that older respondents have stronger brand loyalties. Higher trust in news that they use for older people may reflect established political loyalties and hence correspondingly high levels of trust in media outlets that are aligned with those.
Figure 45: Overall trust in news by political leaning and age
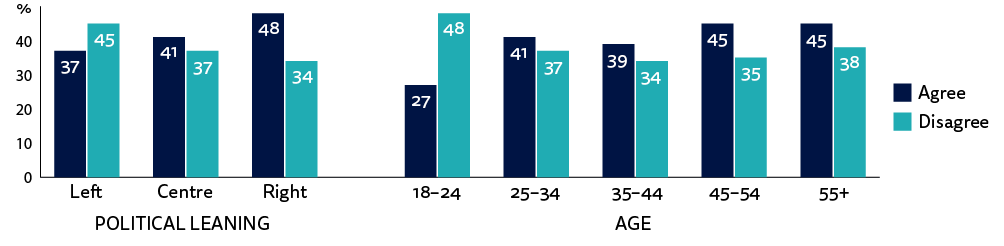
Figure 46: Trust in news I use by political leaning and age
Q6_2016_4. The news media in my country is independent from undue political or government influence most of the time Q6_2016_5. The news media in my country is independent from undue business or commercial influence most of the time
Polarisation in the News Media
First, as Fletcher points out, we should remember that some preliminary evidence in the Digital News Report 2017 suggests that ‘polarisation is increasing in some countries, but also that there is large national variation in the degree to which the audiences for the most popular news brands are polarised along the left–right spectrum’.35 It is true that the standard left–right distinction is less important in Turkey than elsewhere since people have been divided into supporters or opponents of the ruling AK Party, with the key cleavage being the polarisation between Islamism and secularism/Kemalism, the latter represented by the left. One illustration of this degree of polarisation is evident in the readership of the anti-government Sözcü, which is read mainly by people who self-identify on the left (49%) and by only a tiny number who identify on the right (3%).
Although the small difference (six percentage points) between trust in news ‘overall’ (40%) and ‘I use’ (46%) might suggest low levels of political polarisation, this is not the case in Turkey, where society remains deeply divided. The same level of polarisation also applies to the media.
Looking at political orientation and news brands is important to understand the polarisation in the news media. However, it should be emphasised that it is not a good time to ask people’s political preferences in Turkey in an online survey, due to fears about government surveillance. This probably explains why 53% of respondents place themselves in the centre, with 23% to the left, 13% to the right, and 12% responding ‘Do not know’.36 Undecideds in the polls before the historic referendum were described as ‘shy voters’; this term mostly referred to members of the ‘no’ camp who were afraid to reveal their preferences lest they were harassed by the authorities or their neighbours.37
Figure 47: TV & print brands used more than three days per week and political leaning (%)
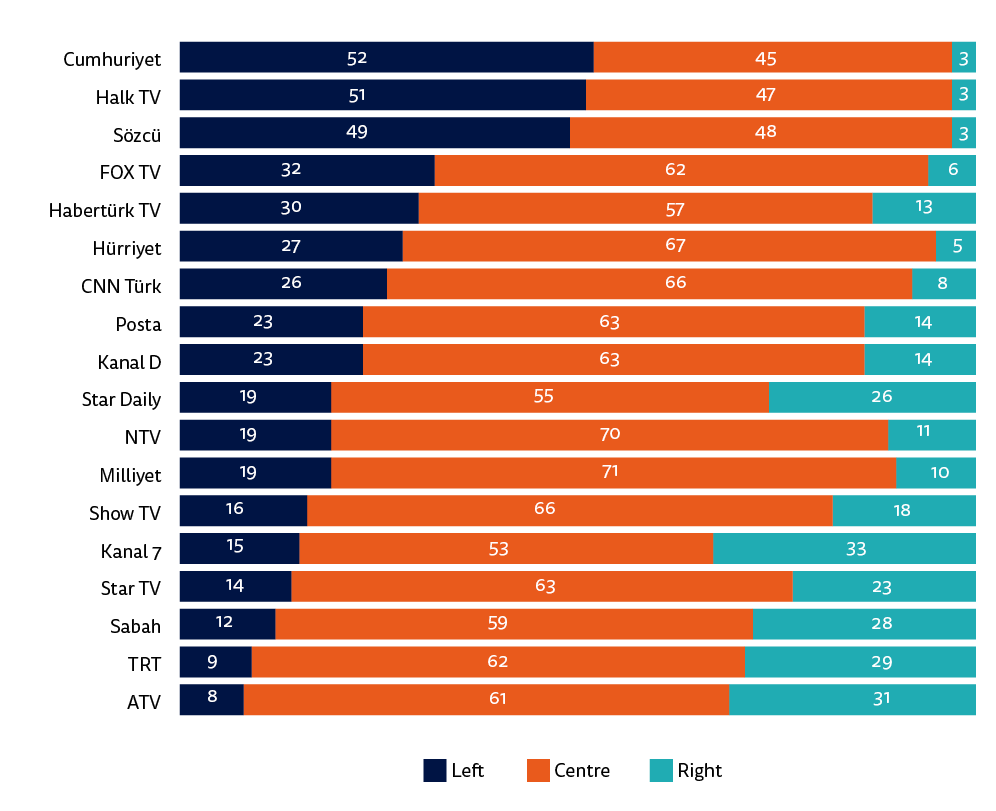
Q1f_rc. Some people talk about ‘left’, ‘right’, and ‘centre’ to describe parties and politicians. (Generally socialist parties would be considered ‘left wing’ while conservative parties would be considered ‘right wing’). With this in mind, where would you place yourself on the following scale? All able to answer if left/centre/right. Q5ai. You said you have used the following brands to access news offline in the last week…Which of these, if any, did you use on three days or more? Please select all that apply.
The consequences of this desire to identify as being centrist can be seen when we look at brands by political orientation (see Fig 47). The audience of the majority of brands place them at the centre, at about 60%. However, the position of three media outlets, namely Sözcü, Cumhuriyet and Halk TV, stands out. Half of their audience place themselves at the left, which is a very high percentage given that we do not see any brand with more than 33% on the right or left. FOX TV and Hürriyet daily skew heavily in favour of left-wing people (32% and 27%, respectively) while Kanal 7 (33%), ATV (31%), public broadcaster TRT (29%), and Sabah (28%) are the brands with the strongest support among right-wing audiences. These results suggest that the position of left-wing media in the top brands of this survey is clearer compared to the right; they have a more loyal and homogeneous audience.
Figure 48: Online sources used more than three days per week and political leaning (%)
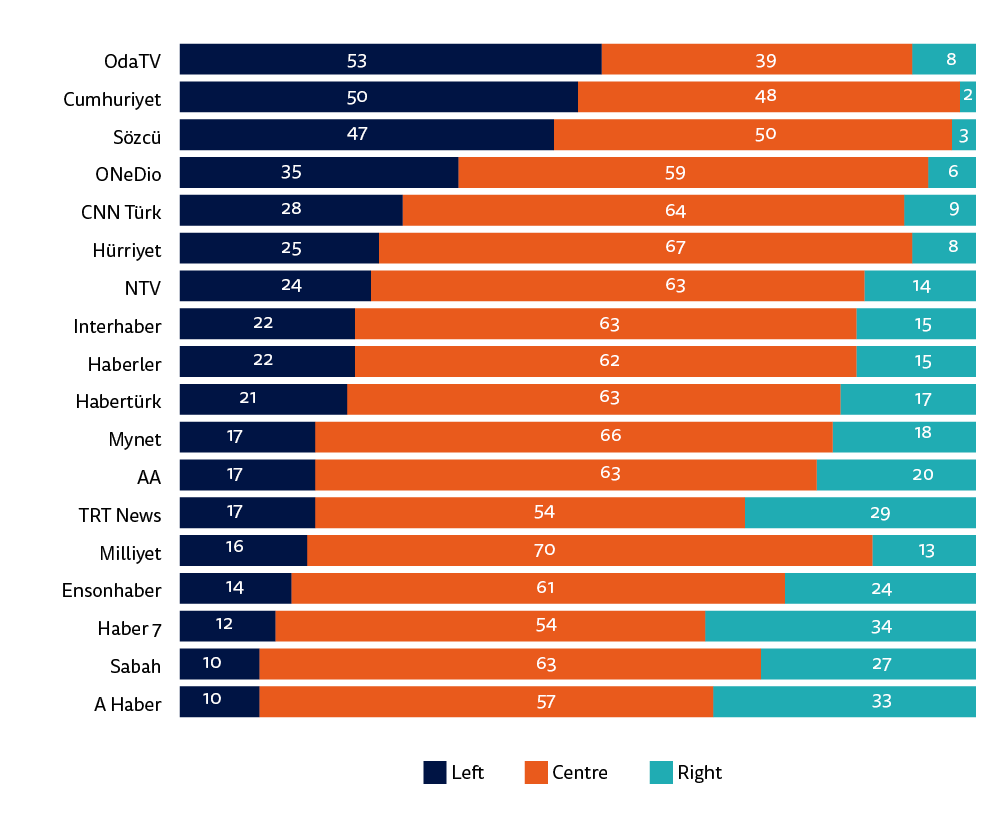
Q1f_rc. Some people talk about ‘left’, ‘right’ and ‘centre’ to describe parties and politicians. (Generally socialist parties would be considered ‘left wing’ while conservative parties would be considered ‘right wing’). With this in mind, where would you place yourself on the following scale? All able to answer if left/centre/right. Q5bi. You said you have used the following brands to access news online in the last week… Which of these, if any, did you use on three days or more? Please select all that apply
The pattern of the audience of the vast majority of brands, placing them at the centre with about 60%, also holds for the online sources used more than three days per week (see Fig 48). Half of the audience of OdaTV, Cumhuriyet and Sözcü are left-wing. A Haber, Haber 7, and Sabah are the most popular online sources for the right-wing respondents. In online news, the level of polarisation is also stronger for left-wing news media than right-wing.
The digital-born brands Oda TV and OneDio draw a larger audience from those who are left-leaning. As to the news aggregators, Mynet, which is the most preferred source at the top of the list in this category, has almost the same audience from both the left and the right. Internethaber and Haberler are more popular on the right than the left, and Ensonhaber is the opposite. Surprisingly, the ratio of respondents from the right or left who consume news from the official Anatolian News Agency is similar.
Questions in the survey about online brands asking ‘which is best for you’ reveal another aspect of deep polarisation. When the respondents are asked ‘In your experience, which of these is best for providing accurate and reliable news?’, we see two brands with strong political positions share the top of the list (Sözcü as severely critical, and A Haber as a loyal supporter of the government). Thirty-nine per cent of Sözcü readers think that Sözcü is best for accurate and reliable news, and 32% of A Haber users think that this brand is best for accurate and reliable news. It can be said that both owe their leading positions to the highly partisan attitudes of their coverage and columnists. (A Haber does not have columnists, but they use columns from Sabah daily, as both are owned by the same media group.)
Participation: News Sharing, Commenting and Social Media Messaging
Top Social Media and Messaging for News
We see that a significant proportion of respondents prefer to share news or talk privately by instant messenger, social media, and email instead of doing so publicly. The sharp downturn in the use of Facebook and Twitter, and the rise of closed messaging for news, may be related to fears about government surveillance. Volunteer informants of the ruling party also have a significant role in this situation, as friends, colleagues, and even spouses are reporting each other for a range of offences.38
First, as shown in Figure 49, we see that all social media networks and messaging applications are more popular in Turkey than the average of all markets. (With the exception of Facebook Messenger for any purpose.) The difference between Turkey and the average of all markets is particularly high in the use of WhatsApp, Twitter, and Instagram, both ‘for any purpose’ and ‘news’. Twenty-five per cent of respondents in Turkey use WhatsApp for ‘news’, whereas the average in the survey is 15% (see Fig 50).
Figure 49: Top social media and messaging apps for any purpose
Figure 50: Top social media and messaging apps for news
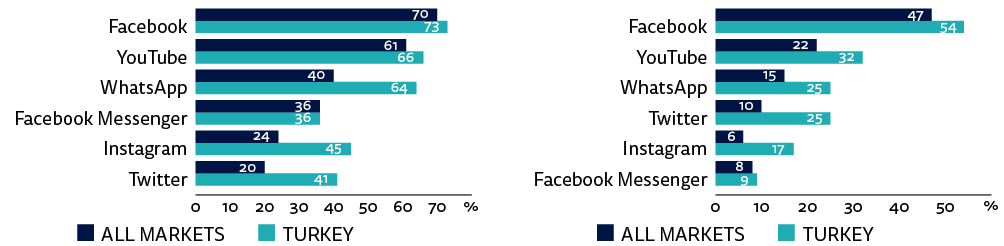
Q12A. Which, if any, of the following have you used for any purpose in the last week? Please select all that apply. Q12B. Which, if any, of the following have you used for finding, reading, watching, sharing, or discussing news in the last week? Please select all that apply.
When we look at the change over time in use of these social networks and applications for news, we can see a remarkable decrease in Facebook and Twitter, particularly in the last year, as Facebook fell by ten percentage points and Twitter was down by five points (see Fig 51). However, Turkey is still at the top of list in the use of Twitter for news in all markets.
Furthermore, we see a striking rise in the use of the closed messaging service WhatsApp, which is up 8%. This may be linked to a climate where it is not safe for public servants, in particular, to criticise the government on social media, and so people adopt more secure messaging apps for sharing news. One Turkish citizen was reported by the Washington Post as explaining his concerns as follows: ‘I avoid talking politics on the phone or in public. I have had to reduce my use of social media because I know they are being monitored.’39
Figure 51: Top social media and messaging for news over time
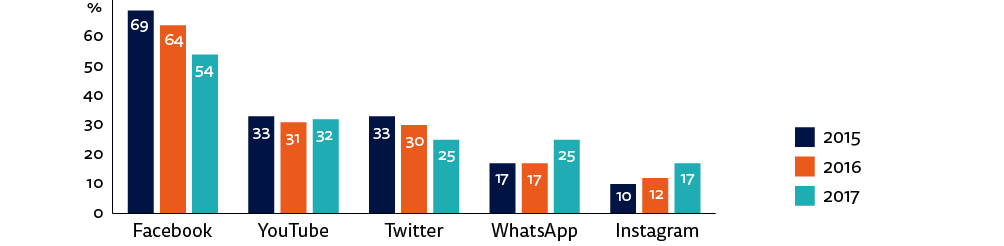
Q12B. Which, if any, of the following have you used for finding, reading, watching, sharing, or discussing news in the last week? Please select all that apply.
Turkey is in second place in European countries in the use of WhatsApp for news, behind Spain (32%), and in ninth place across all 36 markets. The significant point is that use of WhatsApp for news is very low in western countries, whereas it is very high in Latin American countries (Brazil 46% and Chile 39%) and some Asian territories (Malaysia 51% and Hong Kong 36%).
News Sharing and Commenting
Turkey has been increasingly politicised in recent years, and voter turnout is very high as it was over 85% in the last election in 2015 and the historic referendum this year. 40, 41 Politics is part of everyday life in the country, and people largely tend to talk politics. The survey shows that news sharing and commenting are integral to this.
Figure 52: News share and comment
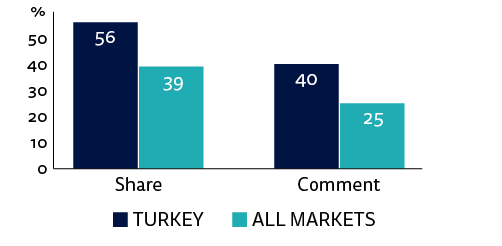
Q13. During an average week in which, if any, of the following ways do you share or participate in news coverage? Please select all that apply.
Fifty-six per cent of respondents share news, and 40% of respondents comment on news in Turkey, while the figures are 39% and 25% in all markets, respectively (see Fig 52). The comparison clearly shows that this is much higher in Turkey than the average of 36 countries. In sharing news, Turkey is at the top among European countries, and is fifth across all markets. Latin American countries (Brazil and Chile with 64%, and Argentina and Mexico with 63%) are at the top of list.
As for commenting, Turkey is in second place among European countries after Romania (42%). Latin American countries (Mexico and Chile with 44%, and Brazil and Chile with 43%) dominate the top of this category as well. We see that news sharing and commenting are not popular in European democracies. It seems that people in highly polarised countries in terms of politics tend to share and participate in news coverage more than other societies.
There are no significant differences in gender and political leaning in sharing news, while it is lower only in 18–24 age group. We have the same pattern for commenting, but the right wing (49%) is a little bit higher than the left (42%). Sharing and commenting is not only intended to criticise the government; it is also about supporting the government. While some people prefer or need to demonstrate their support of the ruling party to gain favour or avoid any possible damage, there is also a significant number of people who do sincerely support it.
Figure 53: Commenting on news on social media over time
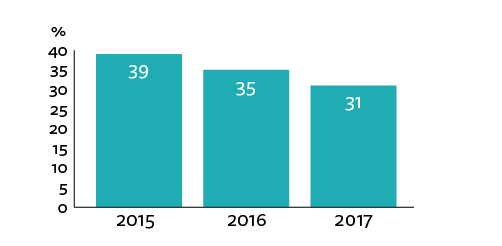 As for commenting on the news on social media, we see a decrease over time as this fell by eight points in two years (see Fig 53). This can also be attributed to fears of government surveillance and informants. People prefer to avoid commenting on news publicly due to the possibility that they might be reported.
Figure 54: News share and comment
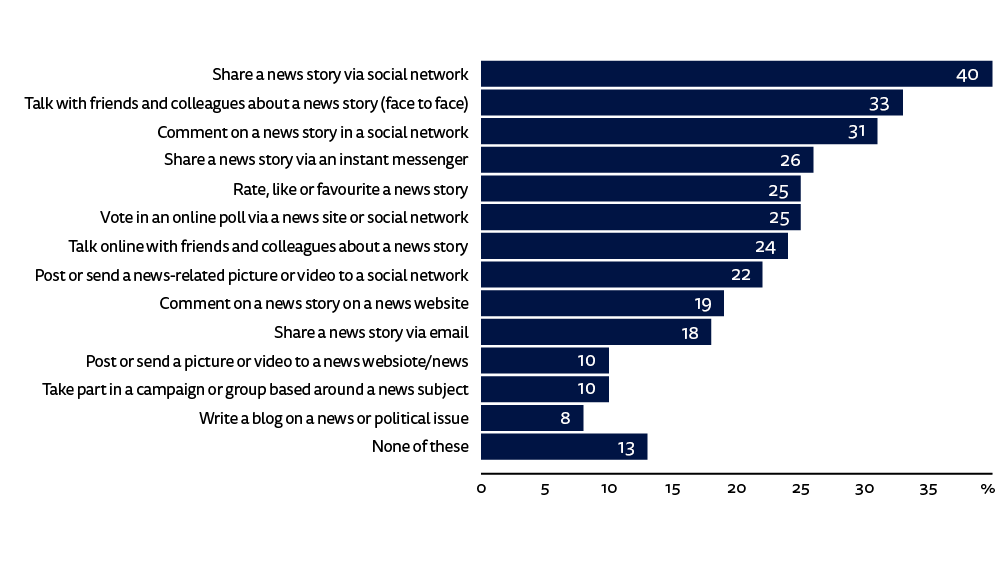
Q13. During an average week in which, if any, of the following ways do you share or participate in news coverage? Please select all that apply.
Despite the higher level of sharing and commenting, 33% of respondents talk with friends and colleagues about a news story face to face (see Fig 54).
Reasons for Not Sharing or Commenting on News
When looking at reasons why Turkish people do not share or comment on the news, we see some interesting trends compared to other countries. The three leading reasons given by Turkish respondents, as shown in Figure 55, are: a lack of interest in commenting/sharing (26% in Turkey versus 37% overall); a preference for face-to-face discussions (23% versus 37%); and/or a belief that it will make no difference, where the Turkish figure of 23% is ahead of the overall average (18%). Turkish respondents are also more concerned about online privacy (20% against 15% across all markets). The most striking difference is in the concerns about ‘being criticised or abused’, which is 17% in Turkey against an average across all countries of 7%.
Figure 55: Reasons for not sharing or commenting on news

Concluding Remarks
In the wake of the failed coup and the subsequent referendum giving the president sweeping new powers, online websites, blogs, and social media have emerged as a centre of opposition. Mainstream media remain largely controlled by the government.
However, the biggest challenge for small-scale online news platforms is financial. They are mostly not based on a sustainable business model and are funded by NGOs or international funds. In such a political atmosphere, they largely focus on pursuing free journalism and not on business models. This era can be seen as a transition period, given that there is not a stable legal environment for media investment, as it only requires an order from a judge for a website to be blocked and closed entirely. It seems that it will take time for significant online investment, particularly from big companies and international players.
There are some ongoing discussions among journalists, media managers, scholars, and activists on the future of online journalism and business models.42 International funders feature prominently in some of them, but these practices and suggestions are also criticised because such journalism becomes dependent on the western world.43 Foundations and international institutions increasingly provide support for news organisations for free journalism. However, the main challenge here is sustainability. As Picard points out, institutions and ‘foundations are not neutral, and their interests change over time and may lose interest’.44
Crowdsourcing has emerged as another option, although it is not as common in Turkey. T24 has made use of this option to some degree. 45 It has become more common, especially during and after the Gezi protests, and it provides editorial independence. However, sustainability is still a challenge in this model as well.
Online subscription seems generally to be the best business model. However, there is a major doubt as to whether it can work, as paying for online news is extremely rare in Turkey. While most printed media outlets do provide an option to subscribe to a PDF format e-edition or pay for web access without advertising, these approaches have not yet been successful. Some dailies, such as Birgün, Evrensel, or Düşünce, that take a particular ideological stance have asked their readers to support their services, but this approach has not been used much. There is little prospect for anti-government publications to make money, as it is so easy for the authorities to block websites or find other ways to cut off funding or readership.
1 https://reutersinstitute.politics.ox.ac.uk/our-research/media-capture-and-advertising-turkey-impact-state-news
2 Available from www.digitalnewsreport.org
3 Finkel, Andrew (2017). ‘Collusion by the Turkish Media Compounds the Country’s Crisis’, in Attacks on the Press: The New Face of Censorship (Committee to Protect Journalists 2017 Edition: Wiley & Sons, New Jersey), pp. 87–96, and Silencing Turkey’s Media: The Government’s Deepening Assault on Critical Journalism (Human Rights Watch Report: 2016)
4 https://www.digitalnewsreport.org/survey/2017/survey-methodology-2017/
5 /wp-content/uploads/2017/06/Digital-News-Report-Questionnaire-2017.pdf?x57165
6 For the list of closed media outlets, see: Akgül, Elif (2016). ‘Balance Sheet of State of Emergency’, Bianet, http://bianet.org/english/media/181486-balance-sheet-of-state-of-emergency
7 It was first blocked in July 2015, for the fifteenth time in December 2016, and the twentieth time in April 2017. Around 40 blockings were implemented between April and August 2017. ‘Blocked for 49 Times, sendika.org Applies for Guinness World Record’, http://web.archive.org/web/20190629073113/http://sendika63.org/. This brand has over 250,000 followers on Twitter.
8 Yesil, B., Sozeri, E.K., and Khazraee, E. (2017). ‘Turkey’s Internet Policy after the Coup Attempt: The Emergence of a Distributed Network of Online Suppression and Surveillance’, The Internet Policy Observatory, http://globalnetpolicy.org/wp-content/uploads/2017/02/Turkey1_v6-1.pdf
9 http://www.tuik.gov.tr/PreHaberBultenleri.do?id=21543
10 http://www.tuik.gov.tr/basinOdasi/haberler/2017_40_20172707.pdf
11 https://mediacat.com/reklamcilar-dernegi-2016-reklam-yatirimlari/
12 Kalogeropoulos, Antonis (2017). ‘News Avoidance’, Reuters Institute Digital News Report 2017, p. 40.
13 Köylü, Hilal (2006). Press Ethics and Practice of Journalism in Turkey. Unpublished MA Thesis, METU
14 Kirisci, Kemal (2017). ‘Referendum results risk further polarization in Turkey’, https://www.brookings.edu/blog/order-from-chaos/2017/04/17/referendum-results-risk-further-polarization-in-turkey/, and Malsin, Jared (2017). ‘Erdogan’s Victory in the Referendum on His Powers Will Leave Turkey Even More Divided’, Time, https://time.com/4741834/turkey-referendum-erdogan-divided/
15 Bayramoglu, Ali (2017). ‘Erdogan Counts on Divisive Campaign Ahead of Key Vote’, Al-monitor http://web.archive.org/web/20170521220353/http://www.al-monitor.com/pulse/originals/2017/02/turkey-constitution-referendum-takes-polarization-new-high.html, and Gurses, Ercan, and Coskun, Orhan (2017). ‘Erdogan Risks Losing Turkish Swing Voters with Harsh Referendum Rhetoric’, Reuters, https://www.reuters.com/article/uk-turkey-politics-referendum-polls-idUKKBN15V2BC
16 ‘Divisive Political Rhetoric a Danger to the World’, BBC, https://www.bbc.co.uk/news/world-39048293
17 Ozkan, Behlul (2017). ‘Erdogan’s Referendum Was Neither Free nor Fair’, Huffington Post, https://www.huffpost.com/entry/turkey-referendum-erdogan_b_58f4bf49e4b0da2ff861c2cc
18 Yeşil, Bilge (2016). Media in New Turkey: The Origins of an Authoritarian Neoliberal State, (Urbana: University of Illinois Press), p. 116.
19 Weise, Zia (2017). ‘Turkish ‘No’ Voices Muffled in Erdoğan’s Referendum’, Politico, https://www.politico.eu/article/turkey-constitutional-referendum-recep-tayyip-erdogan-orhan-pamuk-akp-chp-degirmenci-hurriyet/
20 ‘Turkey’s Vote and the Role of the Media’, Al Jazeera, https://www.aljazeera.com/programmes/listeningpost/2017/04/turkey-vote-role-media-170423100743900.html
21 ‘Turkey Pressures Media Ahead of Erdogan Referendum’, DW, https://www.dw.com/en/turkey-pressures-media-ahead-of-erdogan-referendum/a-37521170
22 Newman, Nic (2017). ‘Executive Summary and Key Findings’, Reuters Institute Digital News Report 2017, p. 11.
23 Newman, Nic (2017). ‘Executive Summary and Key Findings’, Reuters Institute Digital News Report 2017, p. 11.
24 Yeşil, Bilge (2016). Media in New Turkey: The Origins of an Authoritarian Neoliberal State, (Urbana: University of Illinois Press), p. 116.
25 Katik, M. (2013). ‘Turks Deprived of TV Turn to Twitter for Protest News’, BBC, https://www.bbc.co.uk/news/world-europe-22756884
26 Yeşil, Bilge (2016). Media in New Turkey: The Origins of an Authoritarian Neoliberal State, (Urbana: University of Illinois Press), p. 116.
27 ‘Search’ refers to use of a search engine, and typing in a keyword for a news story or a media brand.
28 Newman, Nic (2017). ‘Executive Summary and Key Findings’, Reuters Institute Digital News Report 2017, p.20
29 Newman, Nic (2017). ‘Executive Summary and Key Findings’, Reuters Institute Digital News Report 2017, p.20
30 https://ec.europa.eu/eurostat/statistics-explained/index.php/File:Number_of_books_read_in_the_last_12_months,_2011.png Another study which was released in 2013 reveals that ‘Turks watch an average of six hours of TV a day and surf the internet three hours a day but only dedicate six hours a year to reading a book.’ ‘Poor Reading Habits In Turkey Due To Exam-Based Education System, Haberler.com, http://en.dunyatimes.com/article/poor-reading-habits-in-turkey-due-to-exambased-education-system-70204.html
31 Newman, Nic (2017). ‘Executive Summary and Key Findings’, Reuters Institute Digital News Report 2017, p.20
32 Newman, Nic (2017). ‘Executive Summary and Key Findings’, Reuters Institute Digital News Report 2017, p.20
33 Köksal, Nil (2017). ‘Erdogan Slams “vulgar, worthless” Headline, Promises Punishment’, CBC, https://www.cbc.ca/news/world/turkey-erdogan-press-freedom-1.4004912 and Greenslade, Roy (27 July 2015). ‘Turkish Newspaper Columnist Fired over Tweet Critical of Erdoğan’, Guardian, https://www.theguardian.com/media/greenslade/2015/jul/27/turkish-newspaper-columnist-fired-over-tweet-critical-of-erdogan
34 Newman, Nic (2017). ‘Executive Summary and Key Findings’, Reuters Institute Digital News Report 2017, p.10
35 Fletcher, Richard (2017). ‘Polarisation in the News Media’, Reuters Institute Digital News Report 2017, p. 38.
36 ‘All able to answer if left/centre/right’ results are as follows: centre 60%, left 26%, and right 14%.
37 Interestingly, this term was used by a prominent and credible pollster, İbrahim Uslu, whose wife is Advisor to the Chairperson of the AK Party and a former deputy of the ruling party. Grande, Damon H. (2017). ‘The Straight Truth About Turkey’s Referendum’, Para Analiz, https://www.paraanaliz.com/intelligence/straight-truth-turkeys-referendum/
38 Pitel, L. (16 March 2017). ‘Erdogan’s Informers: Turkey’s Descent into Fear and Betrayal’, Financial Times, https://www.ft.com/content/6af8aaea-0906-11e7-97d1-5e720a26771b, and Güleçyüz, Mehmet (20 January 2016). ‘Looking to Snitch on Your Neighbours? Turkey Will Pay You for the Info’, Al-Monitor, http://web.archive.org/web/20170720124457/http://www.al-monitor.com/pulse/originals/2016/01/turkey-government-offer-financial-perks-for-intelligence.html
39 ‘How Erdogan Has Reshaped Turkey, as Told by Readers’, The Washington Post, 14 April 2017, https://www.washingtonpost.com/gdpr-consent/?next_url=https%3a%2f%2fwww.washingtonpost.com%2fgraphics%2fworld%2fliving-under-akp-turkey-referendum%2f
40 Cagaptay, Soner (2017). ‘Erdogan is Dividing Turkey Against Itself’, https://www.theatlantic.com/international/archive/2017/03/turkey-erdogan-kurds-pkk-isis-syria-coup-gulen/521487/
41 ‘Turnout in Turkey’s Nov. 1 Vote over 85 pct’, Hürriyet Daily News, 2 November 2015, https://www.hurriyetdailynews.com/turnout-in-turkeys-nov-1-vote-over-85-pct-90619, and ‘Turnout in Turkish Referendum Around 86 Percent’, https://www.reuters.com/article/us-turkey-referendum-turnout-idUSKBN17I0JE
42Uzunoğlu, Sarphan (2016).’Gazeteciliği kurtarmak: Dijital yayıncılığın ekonomisi’, Journo, https://journo.com.tr/gazeteciligi-kurtarmak-dijital-yayinciligin-ekonomisi Uzunoğlu, Sarphan (2017). ‘Basılı yayınlar eriyor: Gazeteciliğin Netflix’ini kurmalıyız’, Journo, https://journo.com.tr/gazeteciler-netflix-kurmali
43 Sözeri, Efe Kerem (2017). ‘Türkiye’deki gazeteciliğin kurtuluşu yurt dışında mı?’ Journo, https://journo.com.tr/gazeteciligin-kurtulusu-yurt-disinda-mi Şen, Özgür (2017). ‘AKP’nin medyasından kaçarken Batı’ya bağımlı gazeteciliğe yakalandınız’, Sol Haber, http://haber.sol.org.tr/yazarlar/ozgur-sen/akpnin-medyasindan-kacarken-batiya-bagimli-gazetecilige-yakalandiniz-205839
44 Picard, Robert G. (2014) “Emerging Media Models Through Crowd-sourcing, Creative Commons and Foundation Financed Journalism in the Digital Environment,” presentation to the Asia-Europe Foundation Media Forum, Asian and European Media in the Digital Age, Milan, Italy, October 16, 2014. https://www.asef.org/images/docs/Presentation%20by%20Robert%20PICARD.pdf
45 ‘T24 Okur Fonu’na katılarak bağımsız gazeteciliğe destek verin’, http://t24.com.tr/okurfonu
About the Author
Dr Servet Yanatma is a visiting fellow at the Reuters Institute for the Study of Journalism at the University of Oxford. He was a journalist fellow at the Reuters Institute in the academic year of 2015–16 and wrote the research paper Media Capture and Advertising in Turkey: The Impact of the State on News.1
Servet holds a BA and MA in history from the Bogazici University in Istanbul. In 2015, he completed his PhD programme in Middle East Technical University with his thesis ‘The International News Agencies in the Ottoman Empire, 1854–1908’.
Acknowledgements
The author is very grateful to the following people for their contributions and assistance: Dr David Levy, Director of the Reuters Institute for the Study of Journalism, and Dr Richard Fletcher, Research Fellow at the Reuters Institute for the Study of Journalism.
Published by the Reuters Institute for the Study of Journalism with the support of Google and the Digital News Initiative