
This year we have evidence of the growth of distributed (offsite) news consumption, a sharpening move to mobile and we can reveal the full extent of ad-blocking worldwide. These three trends in combination are putting further severe pressure on the business models of both traditional publishers and new digital-born players – as well as changing the way in which news is packaged and distributed.
Across our 26 countries, we see a common picture of job losses, cost-cutting, and missed targets as falling print revenues combine with the brutal economics of digital in a perfect storm. Almost everywhere we see the further adoption of online platforms and devices for news – largely as a supplement to broadcast but often at the expense of print.
Some of the Key Findings
- Across our entire sample, half (51%) say they use social media as a source of news each week. Around one in ten (12%) say it is their main source. Facebook is by far the
most important network for finding, reading/watching, and sharing news. - Social media are significantly more important for women (who are also less likely to go directly to a news website or app) and for the young. More than a quarter of 18–24s say social media (28%) are their main source of news – more than television (24%) for the first time.
- The growth of news accessed and increasingly consumed via social networks, portals and mobile apps means that the originating news brand gets clearly noticed less than half the time in the UK, and Canada. In countries like Japan and South Korea, where aggregated and distributed news is already more widespread, the brand only gets noticed around a quarter of the time when accessed through news portals.
- Television news still remains most important for older groups but overall usage has continued to decline, particularly for ‘appointment to view’ bulletins and amongst younger groups. In terms of devices, smartphone usage for news is sharply up, reaching half of our global sample (53%), while computer use is falling and tablet growth is flattening out.
- Most consumers are still reluctant to pay for general news online, particularly in the highly competitive English-speaking world (9% average), but in some smaller countries, protected by language, people are twice as likely to pay.
- Business problems for many publishers have worsened with the rise of ad-blocking, which is running at between 10% (Japan) and 38% (Poland) but much higher amongst under-35s and people who use news the most. The vast majority of those who have ever downloaded a blocker are using them regularly, suggesting that once downloaded people rarely go back.
- Only around 8% of smartphone users currently use an ad-blocker but around a third of respondents say they plan to install one on their mobile in the next year.
- Although publishers and technology platforms are pushing online news video hard for commercial reasons, we find evidence that most consumers are still resistant. Three-quarters of respondents (78%) say they still mostly rely on text. When pressed, the main reasons people give for not using more video are that they find reading news quicker and more convenient (41%) and the annoyance of pre-roll advertisements (35%)
- Trust in news is highest in Finland (65%) and lowest in Greece (20%). Almost everywhere, editors and journalists are trusted less than news organisations.
- We find strong concerns that personalised news and more algorithmic selection of news will mean missing out on important information or challenging viewpoints. Having said that, we find that young people are more comfortable with algorithms than with editors.
- Media companies that have nailed their colours to a distributed future like BuzzFeed are gaining ground in terms of reach. But these new brands and platforms are mostly used as secondary sources and for softer news subjects. Main usage online remains with brands that have a strong news heritage and have been able to build up a reputation over time.
Rise of distributed news
We now have five years of data looking at the sources people use for news. In most countries we see a consistent pattern with television news and online news the most frequently accessed, while readership of printed newspapers has declined significantly.
But the biggest change in digital media has been the growth of news accessed via social media sites like Facebook, Twitter, Instagram, and Snapchat. In the United States, to take one example, the percentage of people saying they use social media as a source of news has risen to 46% of our sample – almost doubling since 2013.
SOURCES OF NEWS 2012–16 – TV, ONLINE, AND PRINT + SOCIAL MEDIA
| Online | TV | Printed Newspaper | Social Media | |
|---|---|---|---|---|
| 2012 | 72% | 72% | 38% | |
| 2013 | 75% | 72% | 41% | 27% |
| 2014 | 74% | 68% | 33% | 34% |
| 2015 | 74% | 64% | 23% | 40% |
| 2016 | 73% | 66% | 24% | 46% |
Base:, US: 845/2028/2197/2295/2197
Note: 2014 data has been estimated because of an issue with randomisation of news sources in the questionnaire.
We see the same trends elsewhere; our weighted EU average1 also shows 46% using social media for news – even if some countries like the UK (35%) and Germany (31%) have moved less far in this direction. High adoption in countries like Greece, Brazil and Turkey means that usage across all 26 countries averages 51%.
Social media as a source of news (Selected Countries)

Base: Total sample in each country
But this is not just about access to news via social media, our data suggest that an increasing proportion are coming to depend on it for direct consumption. News has become a more important part of the Facebook mix over the last year. Algorithms have prioritised breaking news, news-related videos, live streams, and other visual content, while publishers have been stepping up their efforts to publish native formats. Since mid-2015 they have been able to publish full ‘instant articles’ within Facebook’s walled garden itself.2 Our focus group research for this year’s Digital News Report shows that, as news now comes to people through social media feeds, there can be less need to go directly to a news website:
The stories that come through are usually the breaking stories that I would otherwise have to go to NewYorkTimes.com. Now I don’t.
(35–54 year old, US Focus Group)
A lot of the breaking news I find through Facebook or Twitter now. It’s really crazy.
Like when David Bowie died.(35–54 year old, US Focus Group)
Taken together, these changes may be contributing to the increase we see in our data around social media as a source of news. Within the EU (10%) and the United States (14%), at least one in ten now say social media are their MAIN source of news, with even higher figures in Australia (18%) and Greece (27%).
GROWTH OF SOCIAL MEDIA AS A MAIN SOURCE OF NEWS (Selected Countries)
| Country | 2015 | 2016 |
|---|---|---|
| FIN | 5 | 5 |
| GER | 5 | 6 |
| JPN | 3 | 7 |
| UK | 6 | 8 |
| NLD | 7 | 8 |
| CZE | 6 | 8 |
| FRA | 5 | 9 |
| AUT | 6 | 10 |
| ITA | 10 | 11 |
| DEN | 6 | 12 |
| SPA | 9 | 13 |
| POL | 11 | 13 |
| USA | 11 | 14 |
| TUR | 13 | 15 |
| IRE | 12 | 15 |
| POR | 12 | 16 |
| BRA | 10 | 18 |
Base: All in 2015/2016 who have used a source of news in the last week: Japan = 1939/1902, UK = 2105/1960, France = 1947/2067, Spain = 2014/2065, Poland = 1995/1969, USA = 2098/2107, Australia = 2023/1949
We also see significant generational and gender differences. We find that women are much more likely to use social media to find news and less likely to go directly to a website or app. Social media – and Facebook in particular – are the only discovery mechanism that appeal more to women than men.
WOMEN ARE MORE LIKELY TO USE SOCIAL MEDIA (ESP. FACEBOOK) TO DISCOVER NEWS (ALL COUNTRIES)
| Male | Female | |
|---|---|---|
| Direct to website or app | 42% | 34% |
| Came across news via social media | 34% | 38% |
Scroll data area to see more
| Male | Female | |
|---|---|---|
| 17% | 16% | |
| Mobile alert | 11% | 10% |
| Search | 40% | 38% |
| Aggregator | 13% | 10% |
Base: Total sample/Male/Female: All countries = 53330/26098/27232
These changes, of course, need to be set in context of wider news consumption. Social media is just one way of accessing online news – the vast majority of which still ends up being consumed on a news website. In addition to online access, most consumers also continue to access news via TV, radio, or print (see chart below) but the extent of this is significantly affected by age. For every group under 45, online news is now more important than television news. For 18–24s social media (28%) comes out ahead of TV (24%) for the first time with print lagging behind at just 6%.
MAIN NEWS SOURCES SPLIT BY AGE (ALL 26 COUNTRIES)
| 18-24 | 25-34 | 35-44 | 45-54 | 55+ | |
|---|---|---|---|---|---|
| Online (Incl. social media) | 64% | 57% | 47% | 36% | 25% |
| Social Media | 28% | 17% | 12% | 8% | 5% |
| Radio | 5% | 6% | 7% | 8% | 8% |
| 6% | 6% | 7% | 8% | 12% | |
| TV | 24% | 29% | 37% | 46% | 53% |
Base: All 18-24s/25-34s/35-44s/45-54s/55+ who have used a news source in the last week: All countries = 5598/9187/9686/9383/18371
These findings about age and gender have significant implications for many news organisations as they rethink their distribution strategies and agendas in order to engage active users onsite, at the same time as less engaged users in social media.
Social Networks for News
In terms of the key social networks for news, we have seen little significant change since last year with Facebook maintaining its dominant position. Across our sample 44% say they use Facebook for news, which in turn represents two-thirds of all Facebook users. YouTube is also a key network (19%) while Twitter remains an important social network for news (10%) favoured by journalists, politicians, and heavy news users in particular. Instagram continues to grow fast, along with WhatsApp in some countries.
TOP SOCIAL NETWORKS (ALL COUNTRIES) – FOR NEWS AND ANY PURPOSE
| Use for news | Use for any purpose | |
|---|---|---|
| 44% | 67% | |
| YouTube | 19% | 57% |
| 8% | 27% | |
| 10% | 19% | |
| 3% | 18% | |
| 3% | 14% | |
| Google+ | 5% | 11% |
| 1% | 9% | |
| Snapchat | 1% | 7% |
| Viber | 1% | 6% |
| Tumblr | 1% | 4% |
| 1% | 3% | |
| Line | 1% | 3% |
Base: Total sample in each country
Facebook is the largest network in every country we have surveyed – with the exception of Japan. This is partly because Japanese prefer networks that allow anonymity, but there are also several popular home-grown networks such as Line and Mixi.
IT’S DIFFERENT IN ASIA (USE FOR NEWS)


In South Korea too, where we have conducted polling for the first time this year, popular messaging apps Kakao Talk (22%) and Kakao Story (9%) are giving Facebook (24%) and Instagram (4%) a run for their money in the news arena.
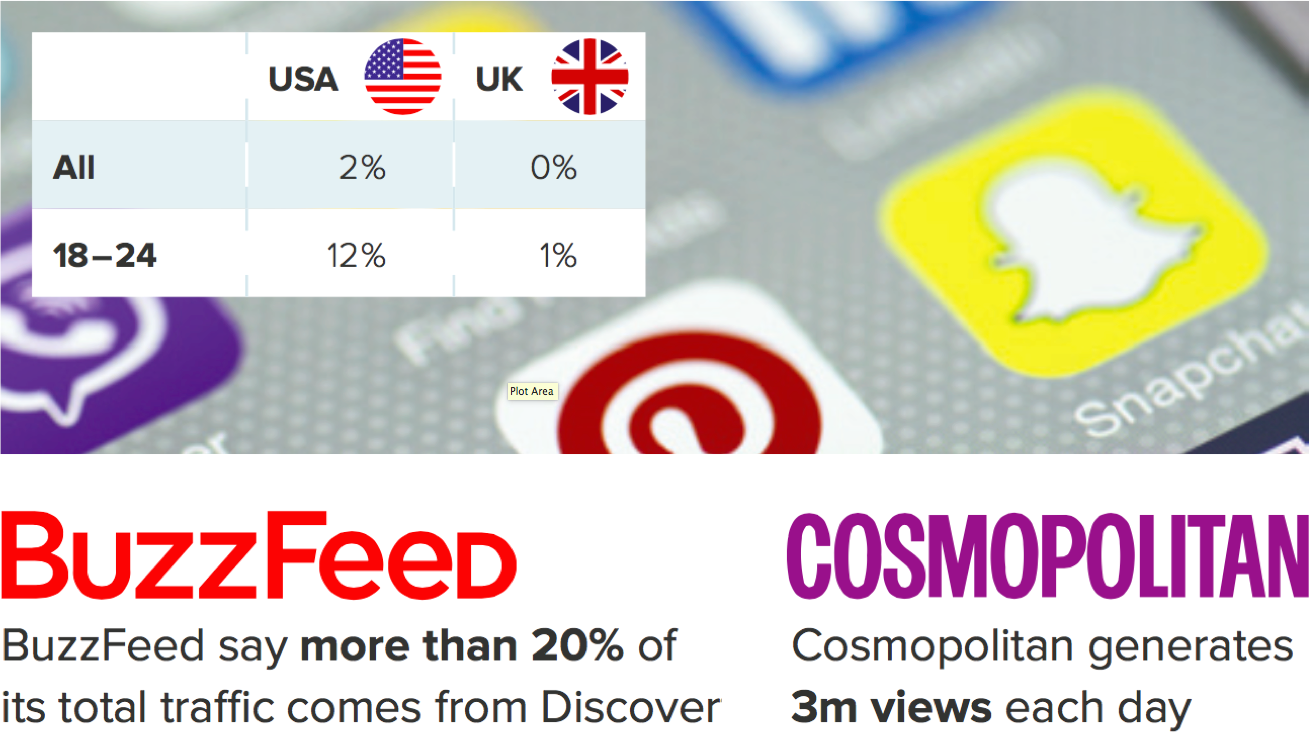
With the exception of WhatsApp and Kakao Talk in Korea, one surprise is the low levels of news usage for messaging applications. Although Snapchat is one of the fastest growing new networks, only around 1% in most countries say they use it for news. For the first time we asked specifically about usage of Snapchat Discover, a poster child for distributed content which was launched at the beginning of 2015 in the UK and US as a showcase for branded news content from publishers like Cosmopolitan, Mail Online, and National Geographic. In our data we find that it reaches 12% of 18–24s of our US sample but so far only 1% in the United Kingdom.
WEEKLY REACH FOR SNAPCHAT DISCOVER
Base: Total sample in each country.
Sharing of news
Social networks are not just important for discovery, they also encourage discussing and sharing the news. Around a quarter of internet news users (24%) share news via social media during the average week; these are people who tend to be passionate about subjects like politics, business, technology, or the environment. The super sharers tend to be heavy news users, often using multiple devices and a significant proportion use the smartphone as a main device.
Most people share predominantly news of which they approve (Finland, Australia, and the United States) which in turn may be affecting the amount of positive news stories that people get exposed to. By contrast, sharers in the UK tend to be more combative – or perhaps more cynical – and are comparatively more likely to share things they don’t like.
The Role of News Aggregators
While Facebook has been the main focus for distributed content over the past year, especially in the US and Europe, it is worth pointing out that platform-based aggregators already play a dominant role in many countries in our study – especially in parts of Asia and continental Europe.
The most popular news destination in Korea is Naver (66% weekly reach), an aggregator and full service portal which includes video, games and email. It is a similar story in Japan where Yahoo (59% weekly reach) aggregates news from multiple publishers across web and mobile. These portals are also the MAIN source of news for a large proportion of the population in these countries and in many cases publishers are paid carriage fees for their content.
In Portugal, much of the news media publish content through the SAPO platform, which is where significant numbers find, read, and share their stories and videos. In Poland, the two biggest news destinations, Onet and WP, are also well-established and well-funded portals which are now branching out to produce more of their own content including video news programmes online.
In some countries we have also seen the arrival of new mobile aggregators such as Apple News, which launched in the US, UK, and Australia in 2015. This provides a personalised interface for multiple branded news sources and provides new competition for existing mobile apps such as Flipboard, SmartNews, and Nuzzel. Tracking usage of these apps is a difficult area to explore because of the difficulty of categorising different types of services (apps, websites, social channels) and then communicating this complexity to survey respondents. But at a headline level it is clear that most are still confined to early adopters and do not yet have anything like the impact of either Facebook or first-wave portals.
NEWS AGGREGATORS AND APPS (SELECTED COUNTRIES)
| UK | AUS | USA | |
|---|---|---|---|
| Apple News | 3% | 4% | 4% |
| 3% | 4% | 4% | |
| Smart News | 1% | 2% | 1% |
Base: Total sample in each country
Google News remains an important aggregator, reaching 24% in Portugal and 20% in Poland but only 4% in the United Kingdom. In the Czech Republic, local search engine Seznam has links to news sources on its homepage with a reach of 74%. We also find strong mobile and web news aggregators in the Nordic region with Ampparit in Finland (11%), Sol (14%) and Startsiden (18%) in Norway, and Omni in Sweden (10%). Meanwhile popular aggregators in Italy include Giornali (17%) and Rassegna Stampa Quotidiani (11%) and in Spain Menéame (3%).
Reasons for Using News Aggregators and Social Networks
We have both survey and focus group evidence this year about why many people are turning to social networks and news aggregators for online news. From our survey data, the key reasons given relate to both speed of update and convenience in bringing multiple sources into one place. Respondents feel that aggregators do a better job of providing quick and easy access to a variety of news sources, but prefer social networks for interactivity.
WHY USE SOCIAL MEDIA/AGGREGATORS FOR NEWS (GERMANY, USA AND UK DATA)
| Social Networks | News Aggregators | |
|---|---|---|
| Alerts and Breaking news | 60% | 56% |
| Simple way to access variety of news sources | 50% | 57% |
| Easy to comment and share news | 35% | 21% |
| Gives me a sense of what news my friends care about | 23% | 12% |
| Learns about preferences so brings relevant news | 16% | 26% |
Base: All that used social media/news aggregators in the last week: US + UK + Germany = 2334/1011
I use a news aggregator called Menéame… with stories ranging from the BBC to El Confidencial. The stories which the users consider to be the most interesting are the ones which make the headlines.
(35–54 year old, Spain Focus Group)
I usually go through Apple News. It gets a variety of things, like I’m interested in certain topics that I probably wouldn’t find or I’d have to search for it myself so it’s like a one stop shop of things that interest me.
(18–34 year old, US Focus Group)
Algorithms vs Editors
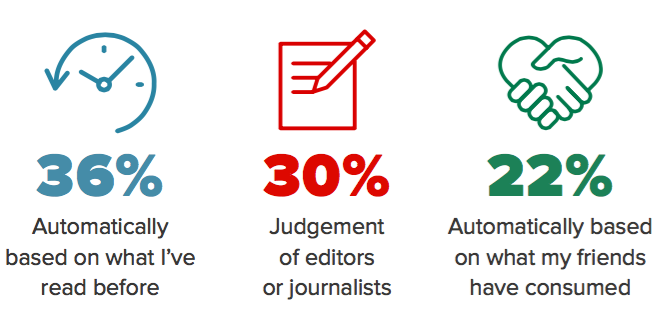
Both social media and personalised news applications are changing the nature of story selection. The choice of whether a story appears in an alert, a feed or aggregated homepage is sometimes decided by an editor but increasingly by computer algorithms that take into account factors that might include (1) recency and popularity, (2) what you’ve read before, and (3) what your friends have been reading or sharing.
This year, we wanted to understand more about how people viewed the idea of algorithms in general, but also what type of recommendations were more valued. The results were, on the surface, a little surprising, with algorithms that take account of what you’ve read before coming out ahead of editorial selection.
I AM HAPPY FOR NEWS TO BE SELECTED FOR ME…
Base: Total sample
One way to interpret this is that, in the end, people think they are the best judge of what they want. Professionals are the next best, and inexpert friends come last. In our focus group work, it was clear that many active internet users now see themselves as editors – balancing and comparing multiple sources, multiple editorial judgements, and even multiple algorithms.
You’ve got to read a few sources to really come up with a true story of things I think. I mean if you want to double check that what you’re reading is true.
(18–34 year old, US Focus Group)
With social media you are your own editor.
(18–34 year old, UK Focus Group)
Respondents everywhere expressed some concerns about the possible negative impact of algorithms, with Norwegians and British amongst those who most fear that key information or challenging viewpoints might be lost in an algorithmically-driven filter bubble.
I AM WORRIED ABOUT PERSONALISED NEWS IF IT MEANS…
| Korea | Japan | EU Weighted Average | USA | UK | Norway | |
|---|---|---|---|---|---|---|
| I might miss key information | 42% | 45% | 56% | 60% | 65% | 68% |
| I might miss challenging viewpoints | 38% | 46% | 53% | 59% | 61% | 67% |
| My privacy is affected | 45% | 44% | 46% | 49% | 49% | 54% |
Base: Total sample in each country
All age groups were equally concerned about these developments though it is important to note the multi-platform nature of most modern news usage. Taking the UK as an example, two-thirds (66%) of social media users also watch TV news in a given week and almost a third (29%) read a printed newspaper. More than half of those using news aggregators (58%) also watch TV news in a given week with a third (34%) reading a printed newspaper.
Looking at news consumption in this holistic way, it is clear that editors still play a considerable role in shaping agendas directly and influencing the stories that emerge in social networks and other aggregators.
Implications of Distributed Content for Media Brands
The growth of distributed content and a consequent increase in algorithmic story selection is one of the hottest topics of media discussion. Academic and media commentator Emily Bell has argued that (a) publishers are losing control of distribution and (b) there is an opaqueness and unpredictability about these algorithms controlled by tech companies and driven by commercial motivations.3
A key related concern is the extent to which news brands are even noticed in distributed environments. This will be critical to whether publishers can capitalise on the reach and exposure that these platforms afford.
In this regard, our data suggest a mixed picture with relatively strong brand recognition in countries like Finland (60%) and Germany (55%), while only around a third say they notice the brand in social networks (most or all of the time) in highly competitive English-speaking markets such as the UK, Australia, and Ireland.
Consumers in some countries say they are even less likely to notice a specific brand when accessing news via an aggregator. In Korea, where aggregated news sites are the norm, only around a quarter say they always or mostly notice the brand.
PERCENTAGE WHO NOTICE NEWS BRANDS VIA SOCIAL MEDIA/AGGREGATORS
| Social media | Aggregators | |
|---|---|---|
| Korea | 23% | 24% |
| Japan | 37% | 26% |
| Canada | 40% | 35% |
| UK | 36% | 38% |
| Denmark | 50% | 46% |
| USA | 49% | 52% |
| Germany | 55% | 52% |
Base: All who used social media/aggregators as a source of news in the last week: Germany = 616/292, Denmark = 1126/150, US = 1018/478, Canada = 947/741, Japan = 552/936, UK = 693/241, Korea = 700/828
These data suggest that, if the rest of the world becomes more like Japan and Korea with aggregated news playing a bigger role, news brands may increasingly struggle to gain recognition and much of the credit may be inherited by the platform.
Devices for news and the rise of mobile
We continue to see rapid adoption of smartphones for news in all the main countries we have been monitoring since 2013 (see next chart). By contrast, computer usage is falling and growth in tablet usage has slowed – falling back in countries like the UK and Japan.
Across our entire sample over half (53%) now say they use a smartphone to access news, with some of the highest levels in three of our new countries, Sweden (69%), Korea (66%), and Switzerland (61%). In all these cases usage is now higher than from computers or laptops. Investment in infrastructure and low data charges have helped some countries get ahead – for example in the Nordic region – while others like Belgium (39%), Canada (39%), Germany (40%), and the Czech Republic (40%) are lagging some way behind.
GROWTH OF SMARTPHONE FOR NEWS 2013–16 (SELECTED COUNTRIES)
| USA | UK | Germany | France | Japan | |
|---|---|---|---|---|---|
| 2013 | 30% | 29% | 22% | 25% | 19% |
| 2014 | 31% | 33% | 32% | 35% | 26% |
| 2015 | 44% | 42% | 34% | 37% | 33% |
| 2016 | 48% | 46% | 40% | 44% | 45% |
Base: Total 2013-2016 sample in each country
ALSO…
| SWE | 69% |
| KOR | 66% |
| NOR | 64% |
| SWI | 61% |
| DEN | 60% |
| IRE | 59% |
Base: Total 2013-2016 sample in each country
Taking the UK as an example, we can see how usage has changed over the last five years. In terms of main device, the mobile/tablet now outstrips the computer. We have reached the mobile tipping point with a publisher like the BBC reporting that around 70% of traffic now comes from mobile devices.
CHANGING DEVICE USE IN UK 2012–16 – WEEKLY REACH PER DEVICE
| Computer | Smartphone | Tablet | |
|---|---|---|---|
| 2012 | 74% | 28% | 8% |
| 2013 | 72% | 29% | 15% |
| 2014 | 56% | 33% | 23% |
| 2015 | 59% | 42% | 31% |
| 2016 | 55% | 46% | 29% |
Base: Total 2012-2016 sample.
CHANGING DEVICE USE IN UK 2012–16 – RISE OF MOBILE (MAIN SOURCE)
| Mobile | Computer | |
|---|---|---|
| 2012 | 17% | 80% |
| 2013 | 24% | 71% |
| 2014 | 40% | 57% |
| 2015 | 45% | 48% |
| 2016 | 50% | 46% |
Base: All in 2013-2016 who used a digital device to access news in the last week: UK = 1638/1598/1795/1691
Note: Mobile refers to combined figures for tablet and smartphone.
In terms of demographics, we see the same pattern of usage across countries. Younger groups show a strong preference for the smartphone while older groups are more comfortable with tablets and computers (see next chart). For some the tablet – with its larger screen size – is replacing the computer as a more flexible shared device in the home, while the personal nature of the smartphone is both extending usage in the home and providing ubiquitous access on the move.
MAIN DEVICES FOR NEWS SPLIT BY AGE (UK ONLY)
| 18-24 | 25-34 | 35-44 | 45-54 | 55+ | |
|---|---|---|---|---|---|
| Smartphone | 54% | 51% | 45% | 25% | 12% |
| Tablet | 10% | 9% | 16% | 18% | 27% |
| Computer | 33% | 35% | 36% | 51% | 57% |
Base: All 18-24s/25-34s/35-44s/45-54s/55+ who used a digital device to access news in the last week: UK = 196/176/254/335/730
Smartphones encourage more frequent access and greater social sharing
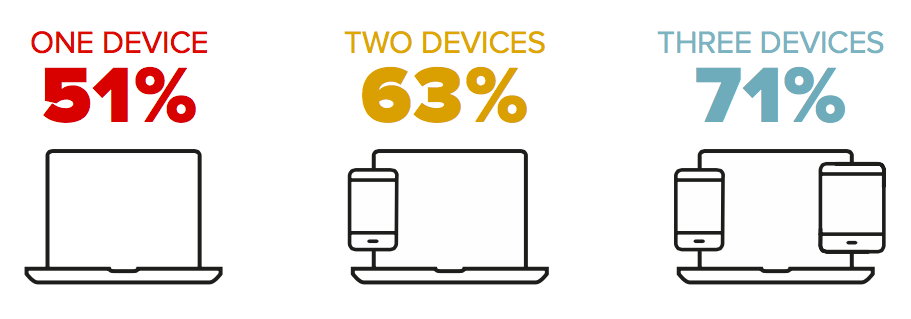
Across our sample we find that heavy smartphone users tend to access the news more frequently than people who mainly use computers or tablets. Almost a fifth (19%) of those who use the smartphone as a MAIN device say they access news more than five times a day. We also find that people who use multiple devices are also much more likely to access news more frequently. To some extent this is because this group is more interested in news but it also the case that every year we see more people using multiple devices. This year almost half (47%) of our entire sample use two or more devices for news each week.
FREQUENCY INCREASES WITH DEVICE USE (ALL COUNTRIES) – % ACCESSING NEWS SEVERAL TIMES/DAY
Q8b. Which of any, of the following devices have you used to access news in the last week?
Base: Total sample
We also have evidence that the move to smartphone goes hand-in-hand with the move to distributed content. When we ask people about the MAIN way in which they come across news stories we see that people use social media more on the smartphone, whilst they are less likely to use a branded entry such as a website or app (see chart right). This is true even if we take account of the fact that smartphone users tend to be younger and tend to use social media more.
MAIN PATHWAYS TO NEWS BY DEVICE (ALL COUNTRIES)
| Computer | Tablet | Smartphone | |
|---|---|---|---|
| Branded entry | 48% | 49% | 41% |
| Social entry | 22% | 21% | 28% |
Base: All using multiple online sources for news and use a computer/smartphone/tablet for news: All countries = 16423/14242/6438
This data helps explain why BuzzFeed’s Jonah Peretti argues that mobile is a much better platform for social content than desktop ever was.4 He says that BuzzFeed is targeting the ‘bored on the sofa network’ in the evenings as much as people who are looking for news and entertainment during the day. In our data, BuzzFeed is up around 5 percentage points in the UK and a similar amount in the United States. Around 75% of its traffic comes from social media – a point reinforced by our focus group respondents who told us that they rarely set out to visit the site directly.
BuzzFeed comes onto my Facebook. I actually got it from my daughter.
(35–54 year old, UK Focus Group)
I only ever find myself there. I’ve never gone to the BuzzFeed website.
(20–34 year old, US Focus Group)
The role of destination and the power of apps
Although newer brands make much of their prowess in distributed news, it is interesting to note that brands like Buzzfeed have started to invest more in apps over the last year as a destination for loyal users5 – and perhaps also to protect themselves from an overdependence on the algorithms of Facebook and other platform providers. A few well-established media brands continue to attract most of their traffic directly with apps, an increasingly important part of a destination strategy.
This year our data shows that app users are much more interested in news than the average web user. They are also better educated and more likely to have paid for online news, perhaps not surprising given that many apps are only usable in conjunction with a subscription. Effectively these are the heavy users and core loyalists that all news organisations – new and old – need to engage with in order to help fund their journalism while reaching out to less committed users via social media.
% USING A NEWS APP ON SMARTPHONE OR TABLET (SELECTED COUNTRIES)
| USA | UK | Germany | Spain | Japan | |
|---|---|---|---|---|---|
| 2014 | 15% | 16% | 12% | 13% | 6% |
| 2015 | 19% | 24% | 14% | 20% | 12% |
| 2016 | 18% | 23% | 17% | 22% | 18% |
Base: Total 2014-16 sample in each country.
Note: Figures based on combined smartphone and tablet news app use.
Another key reason for investing in apps is to enable content to be pushed to smartphone and tablet users. Alerts and notifications are becoming a key weapon for publishers in the battle to attract attention and to bring audiences back more regularly to a particular brand. Our data show strong increases in mobile alerts in Spain (+3) and Austria (+5) this year and a stabilisation of the relatively high levels we have already seen in the US, UK and France. Facebook has also launched a new service called Notify in the US to aggregate and simplify the notification process.
The management of relevant notifications informed by data is becoming an important new discipline in newsrooms with the New York Times amongst publishers setting up a specific team to do this.6
We used to be standing on a hill and shouting messages at people.
Now, there’s a growing number of users who only engage with us when we send a push.Andrew Phelps, Product Director of Messaging and Push, New York Times
% USING PUSH ALERTS AND NOTIFICATIONS FOR NEWS (SELECTED COUNTRIES)
| USA | UK | GER | FRA | SPA | AUT | ITA | |
|---|---|---|---|---|---|---|---|
| 2014 | 6% | 3% | 4% | 6% | 5% | 4% | |
| 2015 | 13% | 10% | 9% | 14% | 8% | 5% | 7% |
| 2016 | 12% | 9% | 8% | 14% | 11% | 10% | 9% |
Base: Total 2014-2016 sample in each country.
Smartwatches for news
For the first time this year, we have tracked the usage of smart watches like the Apple Watch and Samsung Gear. These devices integrate closely with smartphone operating systems and many news companies have developed specific interfaces for the watch along with providing another channel for
push alerts.
So far, however, we find that only a few early adopters have bought these devices with less than 1% in both the US and Europe using them for news. Of those that do use news, push alerts seem to be more popular than going directly to an app, though this is more equally split for weather.
MOST USEFUL ROUTE TO NEWS ON A SMARTWATCH
| Percentage | |
|---|---|
| Receive news alert | 32% |
| Go directly to news app | 14% |
| Receive sport alert | 14% |
| Go directly to sport app | 4% |
| Go directly to weather app | 13% |
| Receive weather alert | 12% |
Base: All who used a smart watch or wristband for news in the last week = 287
First news access in the morning
The addictive nature of smartphones (and smart watches) is also impacting how some people start their day. Mobile internet devices have entered the bedroom and they increasingly take their place alongside radio, television, and print for the right to deliver the first updates of the day.
Many of these early morning news habits have been laid down for generations but we also find significant country-based differences. Over half of our Japanese sample (51%) turn first to television news in the morning, as do 43% of Italians. By contrast, in Ireland, almost four in ten start their day with radio news. But in countries with strong reading cultures, like Finland and Japan, a significant minority still sit down with a printed newspaper in the morning, even though both countries are in other ways extremely digital.
In all seven countries where we asked this question, we find that the internet is first choice for around a third of news consumers, with around half of these using the smartphone and half using a computer.
FIRST WAY OF ACCESSING NEWS (SELECTED COUNTRIES)
| Radio | TV | Computer | Smartphone | Tablet | None of these/Don’t know | ||
|---|---|---|---|---|---|---|---|
| USA | 6% | 12% | 36% | 18% | 17% | 3% | 6% |
| UK | 8% | 24% | 32% | 9% | 16% | 6% | 4% |
| France | 6% | 30% | 28% | 14% | 12% | 3% | 7% |
| Ireland | 4% | 39% | 16% | 14% | 21% | 2% | 3% |
| Finland | 20% | 15% | 20% | 15% | 20% | 5% | 5% |
| Japan | 14% | 3% | 51% | 14% | 13% | 1% | 4% |
| Italy | 6% | 13% | 43% | 16% | 15% | 3% | 4% |
Total sample in each country.
Note: Figures for each country do not always add up to 100% due to rounding.
For those who start their day with a smartphone, almost half in the US turn first to a social network like Facebook (37%) or Twitter (6%) with only a quarter (23%) going to a branded news app or website. In the UK it is a similar story around social media, though more people turn first to a website or app, perhaps because of the strong market position of the BBC.
FIRST NEWS SOURCE WHEN USING A SMARTPHONE (UK)
| Smartphone | |
|---|---|
| News website or app | 48% |
| Aggregator | 8% |
| Homescreen links | 7% |
| Audio/video | 1% |
| 1% | |
| Social | 33% |
| Other/Don’t know | 2% |
Base: All who use a smartphone for news first thing in the morning: UK = 302, US = 334
FIRST NEWS SOURCE WHEN USING A SMARTPHONE (USA)
| Smartphone | |
|---|---|
| News website or app | 23% |
| Aggregator | 15% |
| Homescreen links | 6% |
| Audio/video | 1% |
| 4% | |
| Social | 48% |
| Other/Don’t know | 3% |
Base: All who use a smartphone for news first thing in the morning: UK = 302, US = 334
Types of news and the rise of visual content
The move to mobile and distributed news has also affected the way in which news is packaged and displayed. Over the last few years we have seen fewer people tending to look at a list of news headlines, like the homepage of a website, with more going directly to articles and other news formats.
HOMEPAGES AND OTHER NEWS LISTS HAVE BECOME LESS IMPORTANT (UK)
| 2014 | 2016 | |
|---|---|---|
| List of headlines (e.g. homepage) | 59% | 40% |
| News articles | 43% | 59% |
Base: Total 2014/2016 sample
Looking at data across all our countries we find news articles are still the most consumed type of news content (59%), though we’ve seen the emergence of new formats such as live pages (15%), and Listicles (13%) as well as more visual formats such as picture stories (20%) and info graphics (8%). These formats are integrated into news websites but also play well in social media.
TYPES OF NEWS CONTENT (ALL COUNTRIES)
| 2016 | |
|---|---|
| News articles | 59% |
| List of headlines (e.g. homepage) | 41% |
| Onine news video | 24% |
| Picture gallery | 20% |
| Live page | 15% |
| News blog | 14% |
| Online news audio | 14% |
| List (e.g. top ten) | 13% |
| News graphic | 8% |
Base: Total sample
Video news not growing as fast as expected
One surprise in this year’s data is that online news video appears to be growing more slowly than might be expected. Across all 26 countries only a quarter (24%) of respondents say they access online news video in a given week. This represents surprisingly weak growth given the explosive growth and prominence on the supply side.
Video consumption is highest in the United States (33%), where there has been significant ramp up in production by many news organisations – attracted by higher advertising premiums and better distribution opportunities in social media. By contrast, our weighted European average shows that less than a quarter (22%) are using video news in a given week with some of the lowest levels in Denmark (15%) and the Netherlands (17%).
WEEKLY VIDEO NEWS CONSUMPTION BY COUNTRY
| 2016 | |
|---|---|
| USA | 33% |
| CAN | 32% |
| BRA | 30% |
| GRE | 30% |
| TUR | 29% |
| IRE | 28% |
| POL | 28% |
| AUS | 27% |
| SPA | 27% |
| KOR | 26% |
| HUN | 25% |
| CZE | 24% |
| ITA | 23% |
| NOR | 23% |
| SWE | 23% |
| UK | 22% |
| FRA | 22% |
| BEL | 22% |
| SUI | 21% |
| FIN | 21% |
| POR | 21% |
| GER | 17% |
| AUT | 17% |
| NLD | 17% |
| JPN | 16% |
| DEN | 15% |
Base: Total sample in each country
Across our entire sample, the vast majority (78%) say they only read news in text or occasionally watch news video that looks interesting. Just one in twenty (5%) say they mostly watch rather than read news online. When pressed, the main reason people give for not using more video is that they find text quicker and more convenient (41%). Around a fifth (19%) say that videos often don’t add anything to what is already in the text story.
We also find a significant proportion (35%) that say they are put off by pre-roll advertisements and this figure has increased in a number of countries this year including the United States, France, Finland and the UK.
MAIN BARRIERS TO USING NEWS VIDEO (ALL COUNTRIES)
| 2016 | |
|---|---|
| I find reading quicker and more convenient | 41% |
| Pre-roll ads tend to put me off | 35% |
| Videos take too long to load | 20% |
| I’d rather watch on bigger screen | 19% |
| Videos don’t add to text story | 19% |
| I’m concerned about cost (on mobile) | 9% |
Base: All who did not watch an online news video in the last week: All countries = 40582
Video consumption is becoming more distributed
Much of the growth in news video consumption has come through social networks in the last year. Facebook in particular has increased the prominence of video in its newsfeeds – and pioneered autoplay functionality – with the company reporting 8 billion daily video views by November 20157 as a result. New live streaming services have also played their part in major stories. Twitter’s Periscope was widely used during the Paris and Brussels attacks. Facebook Live is also now available.

A key question for the industry is the extent to which news video is still being consumed directly on news websites or whether it is now mainly consumed within social networks like Facebook, YouTube, Twitter, Instagram or Snapchat.
Across countries, we find a pretty even split between the two, with countries that are particularly active in social media like Brazil (52%) and Greece (48%) consuming news video this way. We also find the under-35s are often much more likely to consume news video through social networks than the population as a whole (see charts below). Even in countries that tend to be less active in social media like Japan, Finland, and Germany, the amount of offsite video consumption is significant. Video formats are now at the heart of the distributed content revolution.
ON-SITE VS SOCIAL VIDEO CONSUMPTION (ALL AGES) SELECTED COUNTRIES
| Mostly watch on news site | Mostly watch via Social Networks | |
|---|---|---|
| JPN | 39% | 15% |
| FIN | 42% | 18% |
| GER | 35% | 19% |
| UK | 36% | 22% |
| FRA | 35% | 29% |
| USA | 33% | 31% |
| SPA | 36% | 38% |
| ITA | 26% | 45% |
| GRE | 37% | 48% |
| BRA | 33% | 52% |
Base: Total sample in each country
ON-SITE VS SOCIAL VIDEO CONSUMPTION (U35s) SELECTED COUNTRIES
| Mostly watch on news site | Mostly watch via Social Networks | |
|---|---|---|
| JPN | 29% | 22% |
| FIN | 35% | 23% |
| GER | 34% | 29% |
| UK | 29% | 38% |
| FRA | 29% | 40% |
| USA | 24% | 46% |
| ITA | 27% | 50% |
| SPA | 27% | 51% |
| GRE | 27% | 58% |
| BRA | 27% | 59% |
Base: Under 35s in each country
In general we also find that most video is still consumed on computers, though this varies across countries and between generations. Younger users do access more video via the smartphone but only to the extent that they use these devices more anyway. On the other hand, we do see a key correlation with social media use. Heavy social media users in particular are around 50% more likely to access online news videos than the general population.
SOCIAL MEDIA USERS ARE MORE LIKELY TO USE NEWS VIDEO
| 2016 | |
|---|---|
| All | 24% |
| Facebook users | 27% |
| YouTube users | 31% |
| Active social users | 36% |
Base: Total sample/Facebook users/YouTube users/Active social users: All countries = 53227/35606/30649/16816.
Note: Active social users are defined as ‘proactive participators’ (see Further Analysis and International Comparison).
Elusive business models and the rise of ad-blocking
Although online has enabled many publishers to reach more people than ever before, the business models around digital remain extremely challenging. This year’s country pages are full of stories of traditional media companies laying off staff in the light of sharp declines in print revenue and continuing problems in monetising audiences online.
In the UK, the Independent has abandoned print entirely, shedding around 75 jobs in the process while the Guardian had a particularly difficult year, losing around £50m.8 News Corp Australia and Fairfax newspapers combined have announced more than 200 editorial staff cuts over the past 12 months, while there have been changes of ownership or significant media consolidation in France and Italy amongst others. Digital born companies have also increasingly been affected by the same trends with BuzzFeed reportedly missing revenue targets9 and Mashable amongst others laying off staff.
Hardest hit have been publishers who depend on digital advertising revenue, which has weakened due to (a) the move to smaller mobile screens (b) the market power of Facebook and Google and (c) the rise of ad-blocking.
According to our data, ad-blocking is running at between 10% (Japan) and 38% (Poland), but much higher amongst under-35s. Most of those who have ever downloaded a blocker are using them regularly, suggesting that once downloaded they rarely go back.
WIDESPREAD USE OF AD-BLOCKING ACROSS MARKETS
| Ad-blocking | |
|---|---|
| POL | 38% |
| GRE | 36% |
| TUR | 31% |
| FRA | 30% |
| IRE | 30% |
| SPA | 28% |
| SWE | 27% |
| POR | 26% |
| AUT | 26% |
| GER | 25% |
| HUN | 25% |
| DEN | 24% |
| FIN | 24% |
| USA | 24% |
| AUS | 23% |
| NOR | 23% |
| BEL | 23% |
| CAN | 22% |
| UK | 21% |
| BRA | 21% |
| CZE | 21% |
| SUI | 20% |
| ITA | 20% |
| NLD | 20% |
| KOR | 12% |
| JPN | 10% |
Base: Total sample in each country
Of those that currently use an ad-blocker, the vast majority do so on their laptop or desktop computer. Across our entire sample, only around one-in-ten (8%) block adverts using their smartphone. However, these numbers may increase with ad-blocking apps and browsers now available for Apple and Android phones. Around a third of our sample say they plan to install an ad-blocker on their smartphones in the next year (this question was asked in Germany, UK, and US only).
A number of publishers have tried requesting readers to turn ad-blockers off while others are going further. Publishers in Sweden, one of the worst affected countries (27%) plan to collectively block all content to those using ad-blockers – offering a choice instead of one-off payments.10 But the fact
that many blockers are young, technically savvy, and have low trust in news organisations may make such initiatives difficult to pull off.
Ad-blocking is highest with the young and with those who use the news most heavily. In countries where ad-blocking is particularly common – such as Poland and Spain – a majority of 18–24 year olds now block adverts. In every country, ad-blocking becomes slightly less common with each increase in age bracket.
PROPORTION WITHIN EACH AGE GROUP THAT CURRENTLY USE AD-BLOCKING
| 18-24 | 25-34 | 35-44 | 45-54 | 55+ | |
|---|---|---|---|---|---|
| Poland | 60% | 53% | 37% | 34% | 25% |
| Spain | 53% | 40% | 29% | 20% | 19% |
| Germany | 48% | 33% | 28% | 24% | 16% |
| UK | 46% | 20% | 17% | 18% | 18% |
| USA | 44% | 29% | 24% | 20% | 17% |
| Japan | 13% | 11% | 12% | 10% | 7% |
Base: 18-24s/25-34s/35-44s/45-54s/55+ in each country.
There is not one single reason for ad-blocking. Mostly it reflects unhappiness with the volume and distracting nature of advertising but there are strong privacy concerns in the Netherlands and Spain. Only around one in ten is worried about the impact of advertisements on data plans or battery life on their smartphones.
Scroll data area to see more
REASONS FOR AD-BLOCKING (SELECTED COUNTRIES)
| USA | UK | GER | FRA | SPA | POL | CAN | POR | NLD | CZE | SPA | |
|---|---|---|---|---|---|---|---|---|---|---|---|
| Volume of ads | 68% | 74% | 64% | 65% | 50% | 65% | 60% | 58% | 48% | 75% | 50% |
| Ads that follow me around | 55% | 56% | 57% | 51% | 52% | 43% | 52% | 56% | 64% | 41% | 52% |
| Improve page load speed | 50% | 42% | 38% | 39% | 40% | 40% | 48% | 41% | 37% | 39% | 40% |
| Reduce mobile data use | 10% | 9% | 14% | 9% | 17% | 15% | 15% | 13% | 11% | 13% | 17% |
| Save battery | 13% | 11% | 13% | 12% | 14% | 13% | 19% | 12% | 12% | 10% | 14% |
Base: All who currently use an adblocker: US = 596, UK = 560, Germany = 649, France = 746, Spain = 736, Poland = 857, Canada = 538, Portugal = 597, Netherlands = 527, Czech Republic = 538
With existing models of online advertising increasingly broken, publishers have renewed their focus on alternative forms such as branded and sponsored content. A number of publishers have set up internal agencies that create content for brands, often using the same formats, fonts and templates as other editorial content. This content may take the form of a list, a video or a microsite. At other times it takes the form of links to branded content from ‘around the web’ provided by companies like Outbrain and Taboola.11
Sponsored content and its labelling is still an emerging area with much room for confusion. In looking at six countries where the practice is most prevalent, we find consumers are most comfortable in Canada and the US and most resistant in Germany and Korea, where only a fifth (21%) agreed that the labelling was sufficiently clear and a third (32%) disagreed.
% THAT SAY LABELLING OF SPONSORED CONTENT IS CLEAR (SELECTED COUNTRIES)
| Agree | |
|---|---|
| Canada | 48% |
| USA | 41% |
| Italy | 39% |
| UK | 36% |
| Germany | 30% |
| Korea | 21% |
Base: Total sample in each country
In these countries, we also compared attitudes to advertising on news websites in general with attitudes to sponsored and branded content. In North America, Italy and the UK there is slightly more acceptance of sponsored content than general display advertising but in Germany and Korea we find more negative attitudes to advertising in general and sponsored content in particular. In all countries, we find younger groups are more prepared to accept advertising for free news, which is surprising given they are also some of the heaviest users of ad blockers.
SPONSORED CONTENT VS DISPLAY ADVERTISING (SELECTED COUNTRIES)
| I am prepared to see sponsored content in exchange for free news | I am prepared to see advertising on news websites in exchange for free news | |
|---|---|---|
| Canada | 50% | 46% |
| USA | 47% | 46% |
| Italy | 41% | 36% |
| UK | 40% | 37% |
| Korea | 30% | 33% |
| Germany | 29% | 33% |
in exchange for free news.
QSPONS1_2016_2: Thinking about sponsored or branded content in online news sites, to what extent to you agree with the following statements: I am prepared to see sponsored or branded content in
exchange for free news.
Base: Total sample in each country
Prospects for paid content online
Whilst around 45% of our total sample pay for a printed newspaper at least once a week, it has been much harder to persuade readers to pay for general news online.
In the United States the percentage paying for any online news in the last year has fallen from 11% to 9% as some paid experiments reverted to free (NYT app) and some paywalls have been abandoned. In the UK too, some paywall strategies have been reversed (e.g. the Sun), whilst others have started focussing more on paid content via membership/premium content (the Guardian). The UK has one of the lowest levels of online payment (7%) along with Greece, Austria and the Czech Republic.
% THAT HAVE PAID (ANYTHING) FOR ONLINE NEWS IN THE LAST YEAR
| Paid for online news in the last year | |
|---|---|
| NOR | 27% |
| POL | 20% |
| SWE | 20% |
| ITA | 16% |
| DEN | 15% |
| FIN | 15% |
| JPN | 12% |
| NLD | 12% |
| BEL | 12% |
| FRA | 11% |
| SUI | 10% |
| AUS | 10% |
| SPA | 10% |
| USA | 9% |
| IRE | 9% |
| POR | 9% |
| CAN | 9% |
| GER | 8% |
| HUN | 8% |
| CZE | 7% |
| AUT | 7% |
| GRE | 7% |
| UK | 7% |
subscription or one off payment for an article or app or e-edition).
Base: Total sample in each country
It is striking that no English-speaking country has a payment rate of more than 10% – likely to be a consequence of intense global competition for digital eyeballs. By contrast some smaller countries protected by geography or language have been able to achieve rates of 20% or more, particularly where there is tradition of newspaper subscription via home delivery to build on.
A strong online presence by a public service broadcaster does not necessarily seem to be a barrier to paying for online news. Norway, Sweden, Finland, and Korea all have strong PSBs and high levels of payment. By contrast, the United States has no significant public broadcasting tradition but has relatively low levels of online payment.
Some counties like Italy show high headline percentages, but have relatively low numbers of digital subscriptions and higher rates of payment for single e-editions. The median reported annual payment for online news ranges from £9 in Poland to £36 in Germany and £82 in the UK – with generally higher yields in countries that have high levels of ongoing subscription.
The importance of trust in news provision
This year we have explored in some detail the role of trust in general as well as specifically in news organisations and journalists. In addition to survey questions we held focus groups in four countries – the UK, US, Germany, and Spain – to understand more about some of the drivers for trusting or not trusting the news.
Overall we find a high level of variation in the extent to which news is trusted across our 26 countries. Typically, affluent Western European and Scandinavian countries with a mix of strong, well-funded public service broadcasters and commercial players scored highly. Trust is lower in the United States (33%) as well as in Southern European countries. In Greece, just one in five (20%) said that they trust the news, the lowest figure in 2016.
% THAT AGREE ‘YOU CAN TRUST MOST NEWS MOST OF THE TIME’
| Agree | |
|---|---|
| FIN | 65% |
| POR | 60% |
| BRA | 58% |
| CAN | 55% |
| POL | 55% |
| NLD | 54% |
| GER | 52% |
| BEL | 51% |
| UK | 50% |
| IRE | 50% |
| SUI | 50% |
| SPA | 47% |
| DEN | 46% |
| NOR | 46% |
| AUS | 43% |
| AUT | 43% |
| JPN | 43% |
| ITA | 42% |
| SWE | 40% |
| TUR | 40% |
| CZE | 34% |
| USA | 33% |
| FRA | 32% |
| HUN | 31% |
| KOR | 22% |
| GRE | 20% |
Base: Total sample in each country
In Greece, the economic crisis has seen a loss of faith in institutions in general and in news organisations across all sections of society – with a particular focus on the under-35s. Trust is also affected by perceptions of political influence over the media in countries like Turkey where the government has clamped down on opposition newspapers and in Hungary where the media is highly politicised; only 14% of our Hungarian respondents agreed that the media were independent from undue political or government influence most of the time, compared with an EU weighted average of 29%.
Business and commercial influence over the news is considered a strong factor in Greece, Hungary, the Czech Republic, Korea, and also the United States. In the US less than one in five (18%) agree with the notion that the news media are independent of business or commercial interests most of the time. Over half (51%) disagree.
News organisations are the key drivers of trust
Our data also show that news brands rather than journalists are the main way in which trust is delivered. Although online news has provided more opportunities for journalists to build their own profiles, interact with readers, and in some cases start their own businesses, established news brands continue to resonate most with readers everywhere – with the exception of France. Journalists carry a particularly low reputation in many countries such as the UK where there is a strong and vigorous tabloid press. Although headline trust levels are quite low, a wide range of research including our own in 2015 has shown that trust is much higher in sources that people actually use.
% THAT AGREE ‘YOU CAN TRUST NEWS ORGANISATIONS/JOURNALISTS MOST OF THE TIME’
| Trust news organisations | Trust journalists | |
|---|---|---|
| FIN | 62% | 51% |
| NLD | 56% | 49% |
| BRA | 56% | 54% |
| POR | 53% | 47% |
| CAN | 52% | 47% |
| BEL | 50% | 48% |
| GER | 47% | 40% |
| IRE | 47% | 37% |
| DEN | 47% | 33% |
| POL | 46% | 42% |
| SPA | 43% | 35% |
| ITA | 43% | 33% |
| AUT | 42% | 32% |
| NOR | 42% | 32% |
| UK | 42% | 29% |
| AUS | 39% | 32% |
| SUI | 39% | 35% |
| TUR | 37% | 34% |
| SWE | 36% | 25% |
| JPN | 33% | 21% |
| USA | 30% | 27% |
| CZE | 29% | 20% |
| FRA | 28% | 29% |
| HUN | 28% | 20% |
| KOR | 17% | 17% |
| GRE | 16% | 11% |
Base: Total sample in each country.
The continued importance of traditional media brands
Our research suggests that even in the era of social media and atomised media, news organisations and traditional news brands still matter enormously.
Although aggregators and social media are important gateways to news, most of the content consumed still comes from newspaper groups, broadcasters, or digital born brands that have invested in original content. Across all of our 26 countries over two-thirds of our sample (69%) access a newspaper brand online each week, with almost as many (62%) accessing the online service of a broadcasting outlet.
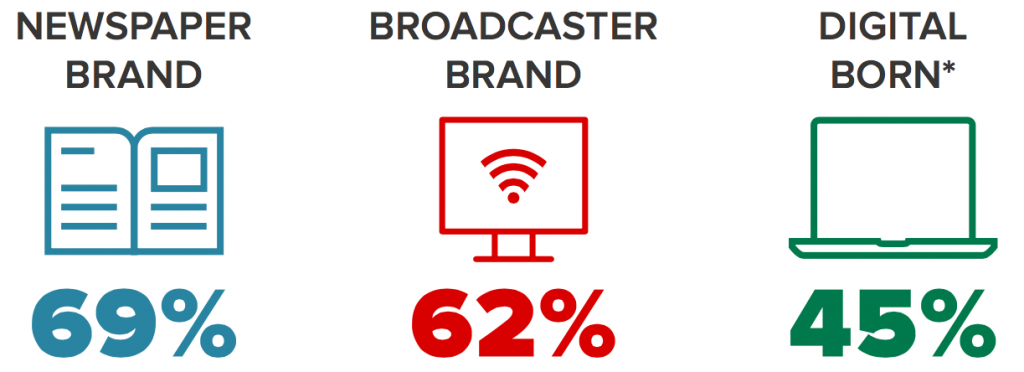
Base: Total sample
*Digital born brands like Buzzfeed and Huffington Post that produce their own content
Second-wave digital-born brands like BuzzFeed and the Huffington Post are growing in reach in many countries around the world, but when asked about their MAIN news source, respondents everywhere were much more likely to turn to a brand with a track record for serious news. This point was also a strong theme in our focus groups:
Q: So do these news brands still matter then?
M: Yeah.
F: Yeah.
Q: And in the future they’ll still matter?
F: I would be disappointed if they didn’t because then how do we know if we’re getting accurate information or not.
M: I still think brand matters, I still think you go to the more reputable ones by far, I don’t think that’s going to change.
% OF TOTAL SAMPLE USING SPECIFIC BRANDS AS THEIR MAIN SOURCE OF ONLINE NEWS (SELECTED COUNTRIES)
Base: Total sample in each country.
Note: Those who did not use an online news source in the last week are recorded as having no main online news source.
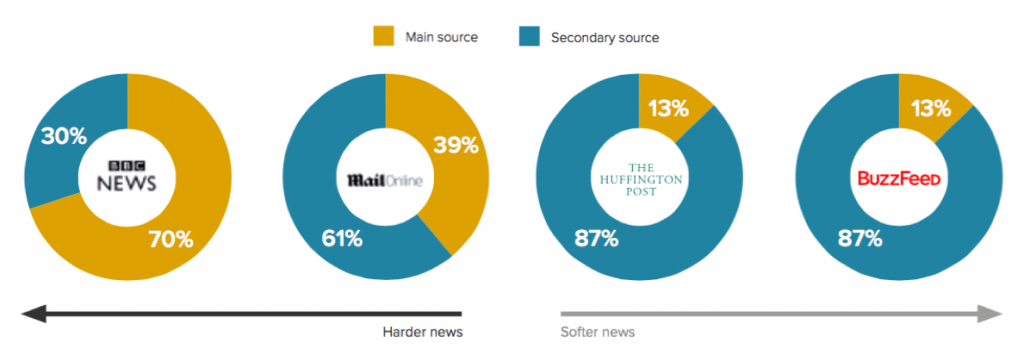
Taking the UK as an example, over a third (36%) of the entire sample say the BBC News website or app is their main source of news. That’s more than two-thirds (70%) of those that use the BBC each week. By contrast only a small percentage of BuzzFeed (13%) or Huffington Post users (13%) say they are their main source in the UK.
% OF THOSE USING SELECTED ONLINE BRANDS WHO SAY IT IS THEIR MAIN SOURCE
Base:All who used BBC, Mail Online, Huffington Post, Buzzfeed as a source of news last week: UK=1101/347/337/183.
You kind of like have a serious news source and then the sort of guilty pleasure sources.
(20–34 year old, UK Focus Group)
Of course this is a complex picture where many digital-born brands, like Quartz, Politico, or Mediapart in France, are also in the business of providing serious news but to niche audiences.
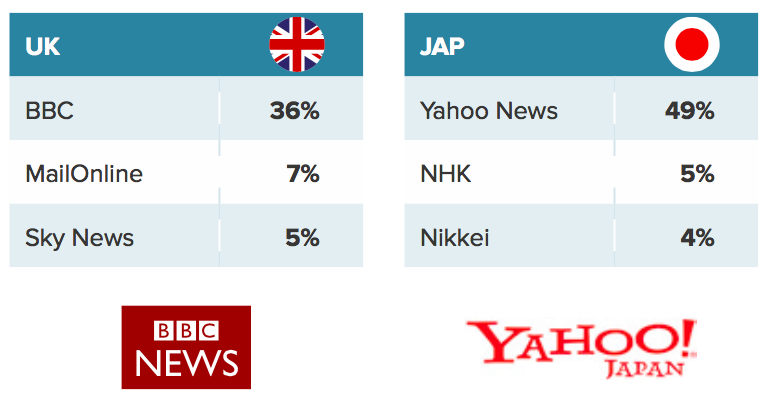
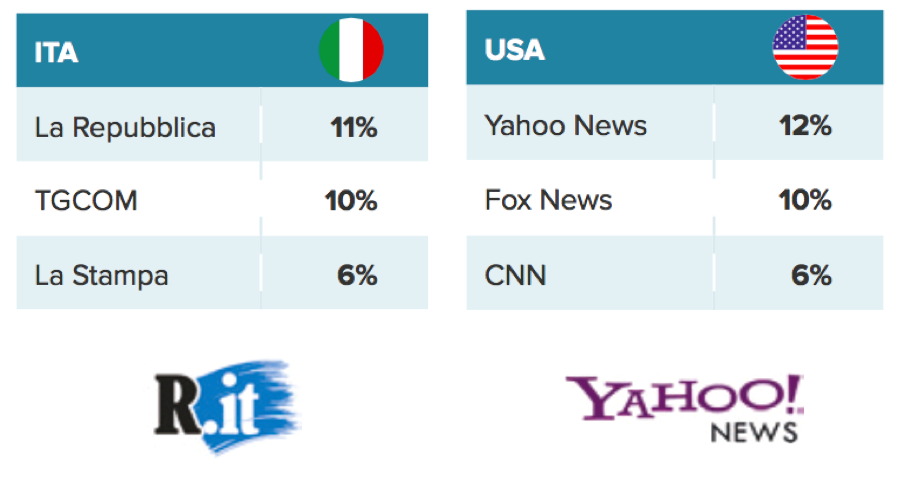
We also find that some aggregator brands like Yahoo News in Japan, Yahoo in the United States, and Naver in Korea are relied on as a main source of news by a significant number of people. By carrying high-quality content where the source is not always noticed, it appears that – over time – these brands have managed to acquire their own credibility as a news source.
Individual brands clearly have different strengths and roles in the ecosystem – across types of news, stages of news story evolution, times of the day, and across different platforms. Traditional brands tend to act as anchors or starting points; native digital brands tend to act as supplementary sources or may help entertain in the downtime.
Country-based differences in digital adoption
As in previous years, we find significant differences across our 26 countries both in terms of the type of news brands that people prefer and the way they access them. Germany and France exhibit the most traditional behaviours with strong continuing preference for TV, radio, and print. By contrast, Korea, Norway, and Sweden have a strongly digital outlook, but traditional media remain both well used and valued.
Greece is in a sense the most digital, but low internet penetration here may be partly responsible for this result as online polls will tend to underplay the strength of TV, radio, and print. Even so, many Greeks have lost trust in traditional media and have been putting their faith in online sites, blogs, and social media instead.
This year’s survey also covers more small countries and three multilingual countries where consumption and media habits are strongly influenced by larger neighbours. Canadian and Irish media companies looking to charge for general news have to cope with strong competition from the US and UK respectively, while German media have also been looking for new markets in Austria and Switzerland. The media systems in both Switzerland and Belgium are particularly complex, subdivided by language with strong cross-border influences.
These differences act as a counter to theories of technological determinism. Culture, habit, geography, regulation, history, company strategies all play their part in how fast or slow digital technologies – and business models – are adopted in any particular country.
Television news losing younger viewers
As we’ve already noted above, we also find strong generational differences in the sources and platforms being used for news. Traditional platforms like TV remain preferred sources for older generations, but are losing traction with the young in most countries.
Over the last three years, the percentage of under-35s who say they access TV bulletins or 24-hour news channels has fallen significantly in the UK and France (around 20 points) and to a slightly lesser extent in the United States and Germany.
ACCESS TO TV NEWS 2013–16 (SELECTED COUNTRIES)
| GER | FRA | UK | USA | |
|---|---|---|---|---|
| 2013 | 82% | 84% | 79% | 72% |
| 2014 | 82% | 82% | 77% | 68% |
| 2015 | 82% | 80% | 75% | 64% |
| 2016 | 78% | 74% | 70% | 66% |
Base: Total sample 2013-2016 sample in each country.
Note: 2014 data has been estimated because of an issue with randomisation of news sources in the questionnaire.
Fall in TV news viewing by under 35s (2013-16)
| GERMANY | FRANCE | UK | USA | |
|---|---|---|---|---|
| 2013 | 70% | 81% | 63% | 55% |
| 2016 | 64% | 61% | 42% | 44% |
| Difference | -6 | -20 | -21 | -11 |
Base: Total sample 2013-2016 sample in each country.
Note: 2014 data has been estimated because of an issue with randomisation of news sources in the questionnaire.
TV news tends to be more important in Europe with its tradition of strong public service broadcasters than in the United States. However, our data do show a slight increase in the US this year, where our polling was done in the week of the Ohio Caucus as the presidential campaign began to hit its stride.
More generally, the rise of the video-enabled internet and the distribution of breaking news through social networks and smartphones is starting to provide alternatives to 24-hour news channels. Al-Jazeera America closed its doors in April 2016 in order to focus its resources on online and mobile channels, while some other established players are contemplating following suit.12
Conclusions
There are two contradictory but important messages in this year’s data. On the one hand we see publishers losing control of distribution, some consumers not noticing where content comes from, and the growing influence of platforms and algorithms. And yet at the same time we find, both in our survey data and our qualitative work, that people still want, value, and identify with traditional news brands.
So how to explain these contradictions? Much probably relates to individual context, to the type of news, or to our often-complex relationship with a particular brand. More of us are accessing news across multiple platforms, through aggregators and social networks, but finding the signal from the noise can be time-consuming and confusing. News brands can help consumers navigate this landscape but to succeed they will need to (a) deliver consistently with a strong audience focus, (b) have a clear identity that matches the content proposition, and (c) excel at distribution in a fast-changing environment.
Social networks and aggregators recognise they need this high-quality content to attract audiences to come back more regularly. At the same time publishers want access to the enormous global audiences that have been built up and fair recompense for the investment they have made in original news content. The key challenge is how to find and maintain an appropriate balance between destination and distribution, between risk and reward.
Whilst some publishers like the Washington Post have gone ‘all-in’ with Facebook Instant Articles, most publishers recognise they will need to ride two horses – investing also in websites and apps where loyal audiences can be nurtured and ultimately monetised.
Driving revenues from online content has become the most critical issue for publishers, particularly those coming from a print background. But the moves to distributed content outlined in this report, the difficult economics of mobile, and the growth of ad-blocking seem to be making sustainable business models more elusive than ever.
As in previous years we see the uneven nature of digital change both across generations and within countries. We see how some countries are protected to a degree by culture, language, or regulation, while others face the full force of digital competition. We see everywhere how young people consume the news differently, with a focus on mobile and social media.
It’s hard to know how far – or how fast – the shift to distributed media will go, but this feels like the beginning of a new phase of media disruption. News organisations will need to keep adapting to the changes ahead – whilst recognising that journalistic track record, trust, and brand equity will remain necessary if not sufficient ingredients of success.
- Average figures are weighted by population of the 17 EU countries we surveyed. Austria, Belgium, Czech Republic, Denmark, Finland, France, Germany, Greece, Hungary, Ireland, Italy, Netherlands, Poland, Portugal, Spain, Sweden, and the UK. This accounts for 91% of the total EU population of all 28 countries. ↩
- Facebook launched Instant Articles in May 2015 with a limited set of content. The format has now been opened to all publishers. ↩
- ‘Facebook is eating the world’: http://www.cjr.org/analysis/facebook_and_media.php ↩
- Jonah Peretti interview with the Financial Times, Mar. 2016: http://www.ft.com/cms/s/0/4f661ea8-e782-11e5-a09b-1f8b0d268c39.html#ixzz43Xmxszfc ↩
- BuzzFeed app strategy from Digiday, Apr. 2016: http://digiday.com/publishers/inside-buzzfeeds-mobile-plans-breaking-news-domination ↩
- Digiday, ‘Inside the New York Times’: http://digiday.com/publishers/inside-new-york-times-new-push-notifications-team ↩
- http://techcrunch.com/2015/11/04/facebook-video-views – NB Facebook register a ‘view’ after three seconds. ↩
- http://www.theguardian.com/media/2016/jan/25/guardian-news-media-to-cut-running-costs ↩
- Financial Times, ‘Buzzfeed misses revenue targets’: http://www.ft.com/cms/s/0%2F26ebf992-00c4-11e6-99cb-83242733f755.html ↩
- Digiday, ‘Sweden’s publishers join forces to block ad-block users’: http://digiday.com/publishers/swedens-publishers-gearing-block-ad-blockers ↩
- Outbrain and Taboola are widely used content discovery platforms that help content producers and brands find audiences through modules that offer sponsored website links. ↩
- Guardian, ‘BBC considers replacing news channel with mobile streaming’: http://www.theguardian.com/media/2015/aug/26/bbc-considers-replacing-news-24-with-mobile-streaming-service ↩